
Thanks to a few top tier catalysts on the calendar, market players were able to bust out a few moves during a mostly quiet, holiday-shortened week.
The main focus seems to have been fresh survey data and economic updates that supported rising odds of a recession ahead, lifting the Swiss franc to the top spot among the currency majors.
But with the latest statements from the Reserve Bank of Australia and Reserve Bank of New Zealand on tap, the biggest short-term moves in the forex space were seen in the Aussie and Kiwi, both ending at the bottom as risk aversion sentiment gained.
Notable News & Economic Updates:
OPEC+ announced surprise output cut to 1.5 million barrels per day starting in May as a “precautionary measure aimed at supporting the stability of the oil market”
J.P.Morgan Global Manufacturing PMI in March: 49.6 vs. 49.9 in February; employment, Input and output prices indexes rose but at slower rates
Asian Development Bank (ADB) revised its forecasts for China’s growth from 4.3% to 5.0% for 2023, saying that its post-COVID reopening will “create the strongest kind of support for growth in the region this year.”
U.S JOLTS job openings tumbled from downgraded 10.56 million in January to 9.93 million in February, falling below 10 million for the first time in nearly two years, reviving fears of a labor market slowdown
Strong export and refining demand dragged the U.S. crude oil stockpiles down by 3.7M barrels vs. an expected 2.3M barrel drop in the week to March 31. – EIA
Finland officially joined NATO, prompting Russia to take “unspecified countermeasures” to ensure its safety against provocations from the West
Central bank updates:
- Hong Kong Monetary Authority acquired HK$7.104B ($905 million) of U.S. dollars on Monday in New York to prevent the local currency from dropping beyond its target range.
- RBA kept interest rates unchanged at 3.60% as expected, toning hawkish rhetoric down from “further tightening will be required” to “further tightening may well be needed”
- RBA head Lowe in a speech later on said that “the decision to hold rates steady this month does not imply that interest rate increases are over
- RBNZ surprised with a 0.50% interest rate hike from 4.75% to 5.25% vs. projected 0.25% increase, citing need to keep inflation in check and reassuring that banks remain well-capitalized
- The central bank of Poland held its benchmark rate at 6.75% on Wednesday as expected.
J.P.Morgan Global Composite Output Index for March: 53.4 vs. 52.1 previous; Employment Index rose 0.4 to 51.9; Input prices Index slowed by 1.0 to 58.7; output prices index ticked lower to 54.9 from 55.3
U.S. jobs data came in mixed this week with private payrolls coming in below expectations, job cuts rising over 300% y/y, government payrolls slightly above expectations and the unemployment rate ticking lower to 3.5%
Intermarket Weekly Recap

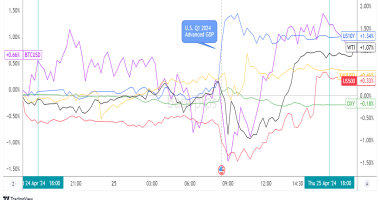
Dollar, Gold, S&P 500, Oil, U.S. 10-yr Yield, Bitcoin Overlay 1-Hour by TradingView
There was no shortage of top-tier events for traders to work with during this holiday shortened trading week, but save a few bursts of volatility here and there, price action was mostly sideways and leaned risk-off as the week went on.
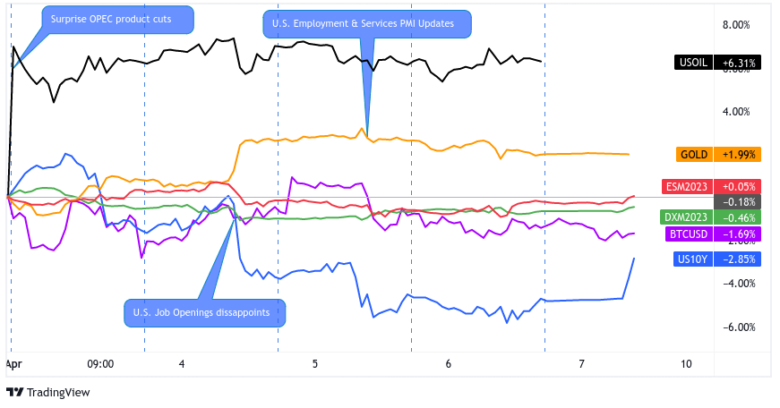
On Monday, the focus was on crude oil and other energy commodities, which gapped sharply higher after weekend news appeared that OPEC+ plans to cut output from 2M bpd to 1.5M bpd in May. Aside from the spike in oil prices, the oil-related Loonie spiked higher on the Monday open as well.
Meanwhile, the U.S. dollar turned downbeat after the latest U.S. manufacturing PMI results showed business sentiment worsening in the U.S., which seems to correlate with a shift further towards broad risk off sentiment, characterized by rising gold against falling bond yields and crypto.
U.S. equity markets escaped the risk aversion vibes, possibly thanks to a surge in energy sector prices, and arguably on the growing theme that the Fed will slow down its pace of monetary policy tightening if economic conditions worsen.
The next significant catalyst of note came on Tuesday after the latest JOLTS job openings report. Traders took particular note of the openings-to-employed ratio, which is said to be one of Fed head Powell’s closely-watched indicators, which tumbled to 1.67 or its lowest read since November 2021. Many say that this, along with the pickup in quits rate to 2.6%, was an omen of more employment declines in the coming months.
Based on the pop in gold against the fall in risk-on asset classes, this was taken as another signal of rising recession risks, along with possibly being a negative leading indicator of the highly anticipated U.S. Non-Farm Payrolls report on Friday.
Not surprisingly, this also led market participants to further scale down Fed tightening expectations, leading to a sharp tumble in the two-year U.S. bond yield by 12bps on the day to 3.84% and a drop in the 10-year rate of 7bps to 3.33%.
The last burst of notable broad market volatility came on Wednesday after the ISM services PMI and ADP non-farm employment change figures turned out weaker-than-expected. The broad market reaction was not as pronounced as on Tuesday, but we did see a noticeable drop in bond yields once again, as well as crypto and equities after the release.
Volatility was subdued on Thursday as the Easter holiday weekend began to kick off across the world in many markets, and it wasn’t until the Friday U.S. jobs data that we got one last round of volatility. Unfortunately for those looking for a big volatility pop, the NFP report came in pretty close to expectations at +236K net job adds (+250K forecast) and the unemployment rate came in at 3.5% as expected.
With the numbers near inline expectations, the reaction wasn’t an unsurprising outcome, especially given that some U.S. markets were already closed and many traders were likely already checked out for the week.
In forex, the biggest price swings arguably came from the Australian and New Zealand dollars. Both countries’ central banks gave their latest monetary policy statements, with the RBA holding off on any changes, while the RBNZ surprised with a larger-than-expected rate hike. This lead to roughly 2% – 3% peak-to-trough moves in both currencies against the majors, with both ending up as the biggest net losers after succumbing to the broad risk aversion environment.
Most Notable FX Moves
USD Pairs

Overlay of USD Pairs: 1-Hour Forex Chart
ISM manufacturing PMI fell from 47.7 to 46.3 in March vs. estimated dip to 47.5 as new orders, production, and backlog contracted
JOLTS job openings fell from 10.56 million to 9.93 million in February vs. projected 10.49 million reading, down to its lowest level since May 2021
ADP non-farm employment change showed a 145K increase in hiring for March vs. estimated 208K figure, February reading upgraded from 242K to 261K
ISM services PMI slipped from 55.1 to 51.2 in March to reflect slower pace of expansion vs. estimated dip to 54.3
U.S. initial jobless claims came in at 228K vs. 200K forecast, previous reading revised from 198K increase in claimants to 248K
U.S. job cuts in March: 89.7K vs. 77.77K in February & 21.38K in February 2022 – Challenger, Gray & Christmas, Inc.
U.S. Non-farm payrolls change for March: 236K (238K forecast) vs. upwardly revised February read of 326K; the unemployment rate ticked lower to 3.5% from 3.6%; average hourly earnings rose to 0.3%
GBP Pairs

Overlay of GBP Pairs: 1-Hour Forex Chart
U.K. Manufacturing PMI for March: 47.9 vs. 49.3 previous; “Input cost and selling price inflation ease further”
- Huw Pill spoke on Tuesday at the International Centre for Monetary and Banking Research
- The U.K.’s financial system is resilient, but the Bank of England’s Monetary Policy Committee is cautious and ready to respond to tightening financial conditions
In 2023, UK inflation is expected to decline, but domestically-driven inflation may persist.
U.K. Construction PMI for March: 50.7 vs. 54.6 in February
Halifax U.K. House Price Index for March: +0.8% m/m vs. 1.2% m/m in February; the annualized rate slowed from 2.1% to 1.6%
EUR Pairs

Overlay of EUR Pairs: 1-Hour Forex Chart
S&P Global Eurozone Manufacturing PMI for March: 47.3 vs. 48.5 previous: “Weak demand and reduced production requirements were central factors which helped to alleviate supplier bottlenecks during March.”
S&P Global / BME Germany Manufacturing PMI for March: 44.7 vs. 46.3; survey results suggest deflationary pressures growing
ECB Governing Council member Robert Holzmann said another 50 bps increase in borrowing prices is “still on the cards” if the global banking sector turmoil does not deepen.
Germany’s trade surplus steadied at around 16 billion EUR in February, with exports growing by 4% m/m – its fastest pace in ten months – and imports accelerating to a three-month high of 4.6%.
Germany’s industrial production rose by more than expected, up by 2.0% m/m in February when analysts only saw a 0.1% increase.
On Friday, ECB Governing Council member Klaas Knot reaffirmed that they are not done with rate hikes, but unsure if the next hike will be 50 bps or 25 bps
CHF Pairs

Overlay of CHF Pairs: 1-Hour Forex Chart
Swiss Consumer Prices Index for March: 2.9% y/y vs. 3.4% y/y in February
Swiss Manufacturing PMI for March: 47.0 vs. 48.9 in February
SNB Vice Chairman Martin Schlegel said the Swiss National Bank will raise interest rates and sell foreign currencies to fight inflation.
Switzerland’s unemployment rate ticked lower from 2.1% to 2.0% in March, its lowest reading since November.
CAD Pairs

Overlay of CAD Pairs: 1-Hour Forex Chart
The Bank of Canada’s latest business outlook survey: “subdued sales outlook and plans for modest growth in capital expenditures. The labour market remains tight, but pressures have eased from high levels.”
S&P Global Canada Manufacturing Purchasing Managers’ Index for March: 48.6 vs. 52.4 in February; Inflation rate is trending lower
Canada Building Permits in February: +8.6% m/m (-2.3% m/m forecast) vs. -3.7% m/m in January
Canada’s trade surplus narrowed sharply from 1.20B CAD in January to 422M CAD in February as both exports (-2.4% m/m) and imports (-1.3%) declined. January’s surplus was also revised way lower from its 1.92B CAD initial reading.
Canadian economy added 34.7K jobs in March vs. estimated 10.2K increase and previous 21.8K gain, enough to keep jobless rate steady at 5.0%
Canada’s Ivey PMI improved from 51.6 to 58.2 in March to reflect sharply stronger industry growth vs. estimated uptick to 52.0
AUD Pairs

Overlay of AUD Pairs: 1-Hour Forex Chart
RBA kept interest rates on hold at 3.60% as central bank acknowledged that economic growth has slowed and that the impact of previous tightening moves is yet to be felt
- RBA policymakers assured that the “Australian banking system is strong, well capitalised and highly liquid. It is well placed to provide the credit that the economy needs.”
- RBA head Lowe explained that rate hike pause doesn’t signal that tightening cycle is over, reiterating that “at our next meeting, we will again review the setting of monetary policy with the benefit of an updated set of forecasts and scenarios”
Australia’s building permits grew by 4.0% m/m in February after a 27.1% slump in January as approvals for private sector houses improved by 11.3%.
Australia’s retail activity saw another 0.2% m/m growth in February, supporting a steadier growth after post-economic reopening spikes in the last three months.
Judo Bank Australia Manufacturing PMI for March: 49.1 vs. 50.5 in February; participants see stresses on global manufacturing complex easing
RBA’s quarterly review recognized increased global stability risks and high interest rates putting pressure on household budgets
Australia’s trade surplus widened from 11.27B AUD to 13.87B AUD in February as imports (-9.1.%) fell faster than exports (-2.9%)
NZD Pairs

Overlay of NZD Pairs: 1-Hour Forex Chart
NZIER’s quarterly business survey showed sales (demand) staking over as primary concern over labor in Q1 2023.
Global Dairy Trade Prices fell -4.7% at the latest auction to an average price of $3.227
RBNZ stuck to hawkish stance with its surprise 0.50% interest rate hike vs. consensus of 0.25% increase
RBNZ statement noted that “inflation is still too high and persistent, and employment is beyond its maximum sustainable level”
JPY Pairs

Overlay of Inverted JPY Pairs: 1-Hour Forex Chart
Tankan Manufacturing Index: Thanks to rising costs and slower overseas growth, sentiment among Japan’s biggest manufacturers has dropped to an index level of 1, the lowest since December 2020. Meanwhile, hopes of a rebound in tourism and services demand led to a steady(ish) index for big services providers.
au Jibun Bank Japan Manufacturing PMI for March: 49.2 vs. 47.7 previous; rate of decline in output and new orders seem to be slowing; sees inflationary pressures remaining high but easing
Japan Average Cash Earnings in February: 1.1% y/y vs. 0.8% y/y previous (14th straight month of increases)
Japan Leading Economic Index for February 2023: 97.7 vs. 96.6 previous, and the highest read since October 2022
Japan Household Spending for February: 1.6% y/y (4.3% y/y forecast) vs. -0.3% y/y