Up next

How to maintain a healthy scalp
The Aussie dollar took the top spot this week, closely followed by the Japanese yen, both likely bid higher after strong inflation updates hit the wires from their respective countries.
And unfortunately for Loonie bulls, the Canadian dollar was the biggest loser, likely driven lower by falling oil prices and net negative commentary from the Bank of Canada this week.
USD Pairs

Overlay of USD vs. Major Currencies Chart by TradingView
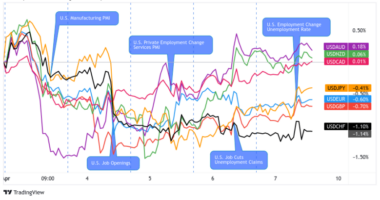
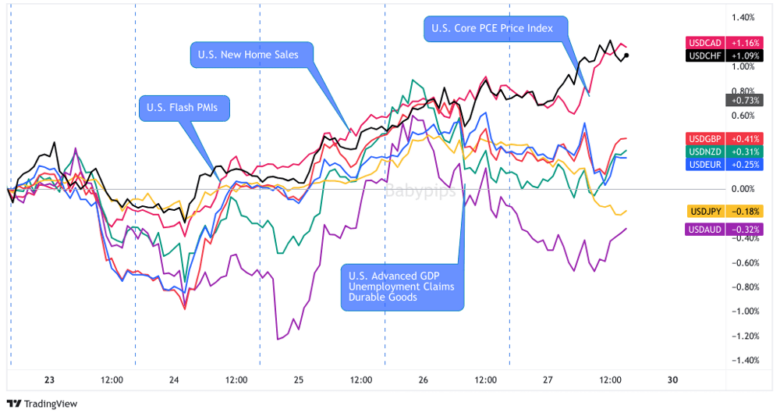
The U.S. dollar was a net winner this week, continuing to find bids as a “safe haven” asset off of geopolitical fears, but also on net positive U.S. economic updates throughout the week.
Both business sentiment and hard data updates like durable goods and GDP showed continued resiliency in the U.S. economy, as well as continuing to give the Federal Reserve room to keep interest rates and monetary policy tight.
🟢 Bullish Headline Arguments
Chicago Fed national activity index +0.02 vs -0.16 prior
S&P Global Flash US Manufacturing PMI for October: 50 vs. 49.8 in September: “The rise in workforce numbers was led by service providers, as manufacturing firms registered a fractional drop in staffing numbers on the month.”; “rates of increase in input costs and output charges slowed at the start of the fourth quarter.”
U.S. New Home Sales for September: 12.3% m/m (-11.0% m/m forecast; -8.2% m/m previous)
Kansas city fed manufacturing actual -8 (Forecast -, previous -13)
U.S Pending home sales for September: 1.1% m/m (-2.0% m/m forecast; -7.1% previous)
U.S. Durable Goods in September: 4.7% m/m (1.1% m/m forecast; -0.1% m/m previous)
U.S. Advance GDP for Q3 2023: 4.9% q/q (4.0% q/q forecast; 2.1% q/q previous); core PCE Prices was 2.4% q/q (3.1% q/q forecast; 3.7% q/q previous)
U.S. Core PCE Price Index for September: 0.3% m/m (0.2% m/m forecast; 0.1% m/m previous); personal spending rose by more than expected / previous at 0.7% m/m (0.5% m/m forecast; 0.4% m/m previous)
U.S. Consumer Sentiment Index (Revised) for October: 63.8 vs (63.0 forecast; 68.1 previous)
🔴 Bearish Headline Arguments
Richmond Manufacturing Activity Index for October came inline with expectations at 3 vs. 5 previous
MBA Mortgage Applications were down -1.0% w/w vs. -6.9% w/w previous; the average 30-Year Mortgage Rate rose from 7.7% to 7.9%
Weekly U.S. Initial jobless claims: 210K (200K forecast / previous); continuing claims rose to 1.79M vs. 1.727M previous
EUR Pairs

Overlay of EUR vs. Major Currencies Chart by TradingView
The euro had an interesting week as we saw action on both sides, eventually leading to a mixed close against the majors. After a Monday rally, the tide turned quickly for the euro after another disappointing flash manufacturing and services PMI update from the Euro area.
After the fall stabilized on Wednesday, traders stayed on the sidelines likely waiting for the upcoming monetary policy statement from the European Central Bank of Thursday. This event actually played out as expected, holding off on interest rate changes and noting risks to economic growth in the region, and sparking very little reaction from the euro on the session.
🟢 Bullish Headline Arguments
German Ifo Business Climate for October: 86.9 (85.3 forecast; 85.8 previous)
ECB President Lagarde says “We are not done yet” fighting high inflation and are “very attentive” in monitoring Middle East conflict risks
The European Central Bank held its main interest rate at 4.50% as expected on Thursday; ECB’s President Lagarde: I am not going to say we are at peak rates.
🔴 Bearish Headline Arguments
Euro Area Flash Consumer Confidence for October came at -18, inline with forecast / previous
Germany’s GfK consumer climate deteriorated from -26.7 to -28.1 in October; “With the third decline in a row, hopes of a recovery in consumer sentiment this year must finally be laid to rest”
Germany’s manufacturing PMI improved from 39.6 to 40.7; Services PMI dropped to contraction territory at 48.0 in October (from 50.3 in September)
Eurozone’s manufacturing PMI worsened from 43.4 to 43.0; Services PMI also deeper into contraction from 48.7 to 47.8 in October
ECB President Lagarde sees potential stagnation conditions over the next few quarters, prices risk becoming more balanced, and signs of economic weakening
Spain’s unemployment rate went up from 11.6% to 11.8% in Q3
GBP Pairs

Overlay of GBP vs. Major Currencies Chart by TradingView
There was very little news from the U.K. for Sterling traders to work with, and what little we saw was pretty much negative. The most notable was the latest manufacturing & services PMI updates, sparking a very solid run lower for the bears during the Tuesday session.
For the rest of the week, the British pound traded as a counter currency and off broad risk flows, which was mostly negative this week and likely why GBP was a net loser at the Friday close.
🔴 Bearish Headline Arguments
U.K.’s adjusted experimental unemployment rate remained at 4.2% in the three months to August; Jobless claimants swell from -9.0K to 20.4K in September
U.K.’s manufacturing PMI improved from 44.3 to 45.2 in October; Services PMI dipped from 49.3 to 49.2
U.K. Retail Sales Volumes in October: -36.0 (-10.0 forecast; -14.0 previous)
CHF Pairs

Overlay of CHF vs. Major Currencies Chart by TradingView
There was only one update from Switzerland this week to potentially influence the Swiss franc, and based on the chart above, there might have been a slight bearish effect from the weaker-than-expected Swiss economic sentiment index update.
Overall, the Swiss franc was in bear mode all week, a bit unusual given the broad risk-off undertones that drove this weeks’ price action. But one can argue that this week’s geopolitical news flow was net less scary with talks of hostage releases, humanitarian aid delivery, and ground invasion delays.
It’s possible that CHF weakness was a position move; arguably traders were lightening up on franc longs sparked by the rise in geopolitical risks, which actually has made the Swiss franc the best performing major currency since the start of the Israeli-Hamas war in early October.
🔴 Bearish Headline Arguments
Swiss Economic Sentiment Index: -37.8 (-24.0 forecast; -27.6 previous)
CAD Pairs

Overlay of CAD vs. Major Currencies Chart by TradingView
The Loonie was a big net loser this week, likely on the combination of falling oil prices (fading “war premium” and rising inventories) and net bearish Bank of Canada monetary policy statement.
The BOC held the main policy rate at 5.00% as expected given the recent misses in hard data, specifically the fall in Canadian retail sales and slow down in inflation rates in September CPI (-0.1% m/m vs. 0.5% m/m forecast; 0.4% m/m previous).
In their statement, they downgraded their growth outlook for 2023 to 1.2% and in 2024 to 0.9%, but sees stubborn inflation conditions as they pushed back the return of 2% inflation hitting at the end of 2025 (vs. mid-2025)
🔴 Bearish Headline Arguments
Canada National Housing Price Index for September: -0.2% m/m (0.0% m/m forecast; 0.1% m/m previous)
The Bank of Canada held the main policy interest rate at 5.00% on Wednesday; also downgraded their outlook for economic growth for both 2023 and 2024.
AUD Pairs

Overlay of AUD vs. Major Currencies Chart by TradingView
The Aussie dollar was on rollercoaster ride this week thanks to inflation updates and commentary from Reserve Bank of Australia Governor Bullock.
With a bit of falling broad risk aversion sentiment and expectations of net higher inflation rates in some metrics, the Aussie rallied early in the week, but then quickly fell right after the CPI update from Australia. Was this a “buy-the-rumor, sell-the-news” scenario or did geopolitical risks overwhelm the inflation update?
We’re not sure, but it after we got comments on the update from Reserve Bank of Australia Governor Bullock on Thursday and a higher-than-expected read on Australian import prices, the Aussie took off higher once again and didn’t look back, likely with the help of one last inflation update on Friday in the form of the latest Australian producer prices index.
🟢 Bullish Headline Arguments
Australia’s inflation sped up from 5.2% y/y to 5.4% y/y in September; quarterly CPI also went up from 0.8% to 1.2% in Q3
Australia’s import prices inched up 0.8% m/m (vs. 0.2% expected, -0.8% previous) in Q3
Australia’s quarterly producer prices higher from 0.5% q/q to 1.8% q/q in Q3
🔴 Bearish Headline Arguments
Australia’s manufacturing PMI fell from 48.7 to 48.0 in October; Services PMI also weakened from 51.8 to 47.6 for the month
Speaking on Thursday, RBA Governor Bullock said that the latest inflation update will likely change forecast, but wasn’t sure if it will be material as this outcome was only a little higher than expected.
NZD Pairs

Overlay of NZD vs. Major Currencies Chart by TradingView
There were no data or news headlines from New Zealand this week, so based on price action alone, it looks like it mirrored the Aussie dollars movements for a lot of the week.
Unfortunately for the bulls, it wasn’t a 1:1 correlation with its close trading partner as geopolitical aversion sentiment (due to announcement of Israel ground operations expanding) came in at the last minute to push the Kiwi lower, moving it into net loser status at the Friday close.
JPY Pairs

Overlay of JPY vs. Major Currencies Chart by TradingView
It was an odd week of price behavior this week for the Japanese yen as yen traders balanced USD/JPY breaking above the 150.00 handle (the level were many saw the BOJ intervening in the FX market), strong inflation updates, weak PMI update, and geopolitical driven broad risk sentiment influences.
Overall, strong inflation and risking risk aversion sentiment was enough for Japanese yen traders to gain against the majors this week, falling only the Aussie, which also found bids on strong inflation updates as well.
🟢 Bullish Headline Arguments
BOJ’s core CPI ticked up from 3.3% to 3.4% y/y in September
Japan’s service producers price index remained at 2.1% y/y (vs. 2.0% expected) in September
Tokyo’s core CPI rose from 2.5% y/y to 2.7% y/y in October
🔴 Bearish Headline Arguments
Japan’s au Jibun flash manufacturing PMI steadied at 48.5 in October (vs. 48.9 expected); “A sustained reduction in new orders led to production shrinking at the fastest rate in eight months.”