As the year 2024 begins and various investment trends emerge, the consequences of a potential shift in the monetary policy of the Federal Reserve are at the forefront of investors’ concerns as they seek to capitalize on a potential decrease in the Fed’s benchmark interest rates.
Among the most closely monitored assets are precious metals such as Gold and Silver, as they could benefit from a decline in interest rates.
For some, Silver could even outperform Gold in 2024 after lagging for several years.
What factors should be considered in this analysis? Why might Silver outperform Gold in 2024, and how could you best take advantage of this situation?
Gold and Silver exhibit a positive correlation, but Silver tends to outperform in times of economic boom

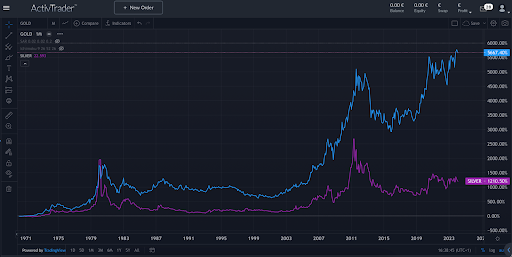
Comparison of the performance of Silver and Gold since 1971
Although both metals typically move in the same direction (positive correlation), Silver tends to lag behind Gold. Moreover, the range in the ratio of their prices, as depicted by the Gold-to-Silver ratio, has fluctuated over the years.
As you can see in the chart below, the ratio has varied from one ounce of Gold buying as little as 32 ounces of Silver during the dip of 2011 to as many as 120 ounces of Silver during the pandemic in 2020. Currently, one ounce of Gold is buying around 90 ounces of Silver.

Monthly chart of the Gold-to-Silver ratio – Source: TradingView
Some analysts, like the Chief Economist and Executive Director of the CME Group, Erik Norland, believe that these differences are mostly due to the various uses of Silver in industrial applications such as in the photovoltaics (P.V.), automotive, and consumer electronics industries, which greatly depend on the stage of the overall economy.
According to the World Silver Survey 2023 from The Silver Institute, investments in 5G network, vehicle output, and construction also helped to support industrial demand for Silver in 2022, as well as soaring silver jewelry fabrication.

Silver global demand – World Silver Survey 2023
In comparison, Gold is mostly favored for jewelry and investment purposes in times of slower economic conditions, uncertainty, market volatility, or geopolitical tensions, but doesn’t have many industrial purposes.

Gold global supply and demand – World Gold Council
This means that Gold tends to outperform in harder times and underperform when the economy is booming, while Silver tends to outperform in times of economic boom and underperform in times of economic downturns.
This dynamic reflects the differing roles that Gold and Silver often play in investors’ portfolios during various economic conditions.
As Gold is often sought after as a safe-haven asset during times of economic uncertainty or market turbulence, its value tends to rise when investors seek refuge from volatility, inflation, or geopolitical risks.
Therefore, during economic downturns or periods of financial instability, investors may flock to Gold as a store of value, driving up its price relative to other assets.
Conversely, Silver’s performance is more closely tied to industrial demand and economic growth. As a result, Silver typically thrives during periods of economic expansion when there’s strong demand for industrial and technological applications.
When economic conditions are robust, industries consume more Silver for manufacturing purposes, boosting its price. However, during economic downturns or slowdowns, industrial demand for Silver may decline, leading to underperformance relative to Gold.
Will Silver outperform Gold in 2024?
As a result of an expected increased industrial offtake, Silver prices are expected to hit a new high level in a decade, reaching almost $30 per ounce, according to the research that was released on January 30th by The Silver Institute.
The report also indicates that global Silver demand might reach its second-highest level on record if it reaches the forecast of 1.2 billion ounces this year. Fed easing is also likely to support Silver prices in 2024 and beyond.
UBS analyst Joni Teves expects Gold prices to keep rising and reach $2,200 by the end of 2024, as the Fed is easing its monetary policy.
As explained in a previous article, when the Fed lowers interest rates, it typically reduces the opportunity cost of holding non-yielding assets like Gold, making Gold comparatively more attractive.
Additionally, lower interest rates can weaken the value of the U.S. dollar and since Gold is priced in dollars, a weaker dollar makes Gold less expensive for investors holding other currencies, usually increasing demand for Gold and pushing its price higher. However, the timeline for when the Fed will commence its interest rate reductions remains uncertain.
While most Fed officials still anticipate three rate cuts this year, they are expected to occur later than what market participants anticipate.
Recent communications from the Fed have tempered market optimism regarding a potential rate cut in March.
This ambiguity could pose short-term challenges for investments in both precious metals, but prices could increase once the Fed starts to cut its Fed Funds with Silver leading, according to experts, but it might depend on the economic conditions that are coming with rate cuts (economic expansion or economic downturn).

Drivers of Gold prices for each major economic scenario of 2024 – World Gold Council
Technical Snapshot of Gold and Silver
Although Gold did not surpass the $2,065.93 mark last month, it continues to trade near its highest closing level, with prices above the Ichimoku cloud and all other lines of the Japanese indicator on the monthly chart.
In contrast, Silver prices have remained below the $25 level since 2021 and are now starting to trade within the cloud, an equilibrium zone, with prices located between the Tenkan and Kijun lines.
If you’re interested in short-term trading of precious metals, consider analyzing the prices of both metals using charts with shorter timeframes.
To take advantage of minor price movements through margin and leverage trading, explore CFD products available through regulated brokers such as ActivTrades

Monthly Silver and Gold charts – Source: ActivTrader
The information provided does not constitute investment research. The material has not been prepared in accordance with the legal requirements designed to promote the independence of investment research and as such is to be considered to be a marketing communication.
All information has been prepared by ActivTrades (“AT”). The information does not contain a record of AT’s prices, or an offer of or solicitation for a transaction in any financial instrument. No representation or warranty is given as to the accuracy or completeness of this information.
Any material provided does not have regard to the specific investment objective and financial situation of any person who may receive it. Past performance is not a reliable indicator of future performance. AT provides an execution-only service. Consequently, any person acting on the information provided does so at their own risk.