Start your trading prep with an overview of catalysts coming up.
I’ve got some chart setups to keep tabs on, too!

Take a look at how the majors performed recently and the upcoming catalysts to watch out for:

Major FX Pairs Overview
USD
The dollar was off to a good start and was cruising in the green for the most part of the week. Bears took over on Friday when risk appetite picked up on stimulus hopes, though.
U.S. CPI readings are up for release this week, and Fed head Powell’s speech would definitely be worth watching if you’re trading USD pairs. Read more.
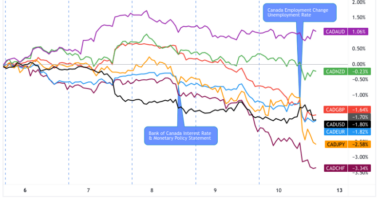
CAD
No data? No problem! The Loonie was able to pull off a positive performance thanks to risk-on flows and rising crude oil prices.
There are no major reports on Canada’s economic schedule for the week, but the same factors might come into play for the Loonie again! Read more.
EUR & CHF
Weak data from Europe and stronger demand for the U.S. dollar sapped demand for the euro while the franc reeled from currency intervention rumors.
German trade and industrial production data could set the tone for euro price action this week, along with overall market sentiment. Read more.
GBP
Sterling was off to a slow start, but bulls managed to pick up the pace throughout the week as the BOE sounded less dovish on Super Thursday.
BOE Governor Bailey’s speech could be worth watching, along with the preliminary Q4 GDP and industrial production releases later in the week. Read more.
JPY
Yen pairs had a choppy run for the most part of the week, before the Japanese currency took bigger hits from risk-on flows by Friday.
There are no major reports due from Japan, and the shortened trading week could mean slower price action all throughout. Read more.
AUD
Dovish RBA rhetoric? Who cares? Aussie bulls were still able to take the currency to the top spot thanks to stronger risk appetite.
There are no major reports due from the Land Down Under this time, which suggests that market sentiment might be the main driver of AUD price action. Read more.
NZD
The Kiwi was unable to benefit from risk-on flows and upbeat jobs data from New Zealand, as it closed the week on a mixed note.
New Zealand’s quarterly inflation expectations report is up for release, but traders might still turn to risk sentiment for direction. Read more.
Forex Charts to Watch:
EUR/USD: 1-hour

Let’s start off with this simple triangle break-and-retest on the 1-hour chart of EUR/USD.
Price recently fell through the triangle bottom then dipped to a low of 1.1950 before pulling back up. The Fib retracement tool shows that the broken support lines up with the 50% level where sellers might be hanging out.
A larger correction could reach the 61.8% Fib near the 200 SMA. The faster-moving 100 SMA is below this slower-moving MA to confirm that resistance levels are more likely to hold than break.
At the same time, Stochastic is turning lower from the oversold region to signal a pickup in selling pressure.
USD/CHF: 1-hour

Here’s another break-and-retest play yo!
USD/CHF recently broke above the neckline of an inverted head and shoulders pattern but looks prime for a pullback to the area of interest.
This coincides neatly with the 100 SMA dynamic inflection point, which adds to its strength as a floor. A shallow correction could already find buyers at the 38.2% Fib at .8967 or the 50% level at .8942.
It looks like Stochastic has a bit more room to head south before reaching the oversold region, so the correction could keep going until sellers are exhausted.
CAD/JPY: 4-hour

Watch out for a breakout on this one, fellas!
CAD/JPY is still in tight consolidation mode inside a rising wedge pattern on the 4-hour time frame, and it looks like the pair is prepping for a big move.
Technical indicators are looking mixed when it comes to hinting which direction price might go. Stochastic has reached the overbought zone to signal exhaustion among buyers, but the 100 SMA is above the 200 SMA to suggest that an upside breakout is possible.
In any case, be ready to catch a rally or selloff that’s at least the same height as the wedge pattern once a breakout takes place!