
The U.S. dollar had a stellar week thanks to updates showing the U.S.’s economic resiliency relative to the globe, building the case for another Fed rate hike ahead.
The Loonie came in a close second thanks to a strong move higher in oil prices and a surprisingly hot employment update from Canada.
Missed the major forex headlines? Here’s what you need to know from last week’s FX action:
USD Pairs

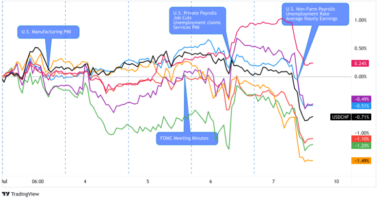
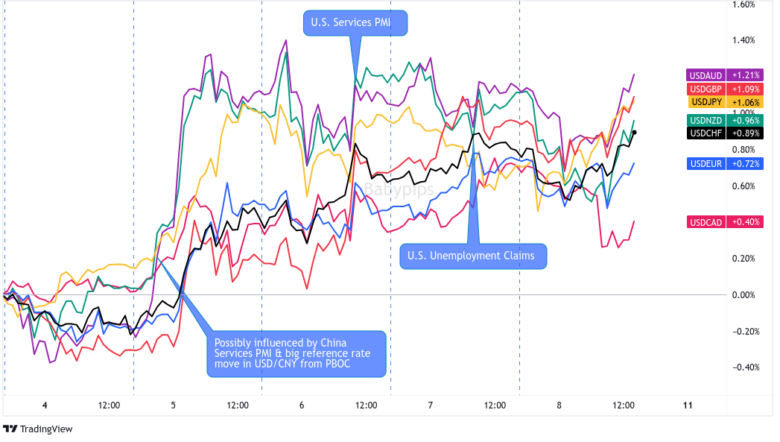
The U.S. dollar easily took the crown this week, with several factors likely drawing buyers to the Greenback. First, it was possibly the moves to set the reference rate higher in USD/CNY by the People’s Bank of China and the weak Chinese Services PMI update that sent plenty of traders to the Greenback.
We also got a much better-than-expected U.S. Services PMI read, once again signaling to the world that the U.S. is pretty resilient while the rest of the world slows. This was confirmed further again on Thursday after a better-than-expected U.S. weekly initial jobless claims update.
🟢 Bullish Headline Arguments
Cleveland Fed President Loretta Mester said on Tuesday that interest rates may need to be “a bit higher,” but said that there’s plenty of time until the next meeting to weigh upcoming data
ISM Services PMI for August: 54.5 (52.5 forecast; 52.7 previous); Employment Index jumps from 50.7 to 54.7; Prices Index rose from 56.8 to 58.9
Weekly initial jobless claims fell to 216K (239K forecast; 229K previous)
Unit labor costs in the nonfarm business sector increased 2.2% in Q2 2023, reflecting a 5.7% increase in hourly compensation and a 3.5% increase in productivity.
🔴 Bearish Headline Arguments
Federal Reserve Governor Christopher Waller said that the Fed can “proceed carefully” on interest rates with recent easing in inflation data
S&P Global Services PMI for August: 50.5 vs. 52.3 in July; businesses are starting to see waning post-pandemic economic strength; sees renewed “upward pressure on energy, fuel & transportation costs”
Balance of Trade deficit for July 2023: -$65B vs. a -$63.7B deficit in June 2023
FOMC member Lorie Logan: “Another skip could be appropriate” in September but her base case is that “there is work left to do” to combat excess inflation
EUR Pairs

Overlay of EUR vs. Major Currencies Chart by TV
Euro area services PMI data continued to point to slowing business activity, but that didn’t stop the euro from being a net winner on the week. It’s likely that the risk averse environment was the contributor to the euro’s relative strength, given the lack of major positive headlines from Europe this week.
🟢 Bullish Headline Arguments
Spain Unemployment Change for August: +0.93% m/m to +24.8K; total unemployed registered at 2.7M (the lowest level since August 2008)
Bundesbank Bank President Joachim Nagel said on Monday that he’d be open to raising reserve requirements after the ECB stopped paying interest on them starting Sept. 20
The latest ECB Consumer Expectation Survey showed rising inflation expectations
France payroll employment change for Q2 2023: +0.1% q/q as expected vs. +0.3% q/q previous
🔴 Bearish Headline Arguments
HCOB Germany Services PMI for August was significantly weaker at 47.3 vs. 52.3 in July; “Falling workloads and muted business expectations placed the brakes on job creation across the service sector in August”
HCOB Eurozone Services PMI Business Activity Index for August: 47.9 vs. 50.9 in July; The rate of contraction in New Contracts was the strongest in two-and-a-half years; input prices rose at the fastest rate in 3 months
Germany’s trade surplus narrowed from €18.7B EUR to €15.9B vs. €17.6B forecast in July, as exports fell 0.9% m/m while imports rose 1.4% m/m
Sentix Investor Confidence Index for September: -21.5 vs. -18.9 previous
German factory orders tumbled 11.4% m/m in July vs. expected 4.3% decrease and previous 7.6% gain (upgraded from the initially reported 7.0% figure)
On Monday, European Central Bank Governing Council member Mario Centeno warned of the dangers of raising interest rates too much
Euro area PPI for July was -0.5% m/m (-0.8% m/m forecast; -0.4% m/m previous)
Euro area Retail trade volumes for July 2023: -0.2% m/m & -1.0% y/y
German industrial production slumped by 0.8% m/m in July vs. an estimated 0.4% dip and earlier 1.5% decline
Final read for Euro Area Q2 2023 GDP: 0.1% q/q (0.3% q/q forecast; 0.1% q/q previous); Employment Change was 0.2% q/q (0.2% q/q forecast; 0.5% q/q previous)
GBP Pairs

Overlay of GBP vs. Major Currencies Chart by TV
After an early run higher for the bulls, Sterling took a turn to the downside, roughly correlating with the disappointing U.K. Services PMI update on Tuesday. While coming out better-than-expected, this was the first contractionary survey since early 2023, which also pointed out slowing metrics in both employment and input prices conditions.
But the bearishness really picked up speed on Wednesday during the Bank of England’s testimony to U.K. lawmakers, most likely driven by comments that further rate hikes may no longer be needed.
🟢 Bullish Headline Arguments
BRC retail sales advanced from 1.8% to 4.3% y/y in August, outpacing consensus of 2.2% increase to show strong surge in spending
🔴 Bearish Headline Arguments
S&P Global / CIPS UK Services PMI for August: 49.5 vs. 51.5 in July; Employment and Input Prices Indexes continue to trend lower but remain relatively strong
Bank of England Monetary Policy hearings to U.K. Parliament: BOE Governor Bailey said on Wednesday to lawmakers that they are no longer in a phase where it was clear that rates needed to rise and that policy is restrictive.
Halifax HPI slumped -1.9% m/m in August (-0.4% m/m in July), marking its steepest drop since November last year, vs. estimated -0.1% on impact of higher interest rates
CHF Pairs

It was a mixed week for the Swiss franc as Switzerland’s latest economic reads (GDP and the unemployment rat were arguably disappointing) likely conflicted with the broad risk averse environment. Overall, the franc was able to outperform four out of its seven major counterparts, signaling that once again, broad risk sentiment dominates all.
🔴 Bearish Headline Arguments
GDP showed that economic activity was flat in Q2 vs. estimated 0.1% q/q growth figure and earlier 0.3% expansion
Unemployment Rate for August: 2.0% vs. 1.9% forecast / previous
AUD Pairs

Lots of red for the Aussie early in the week, first sparked by weaker-than-expected Chinese Services PMI data on Tuesday, which was quickly followed by an interest rate hold from the Reserve Bank of Australia.
Not only did they hold off on a rate hike, but the RBA also noted that the high inflationary environment may have already passed its peak.
🟢 Bullish Headline Arguments
Australia’s ANZ job advertisements accelerated from an upgraded 0.7% m/m increase in July to 1.9% in August, hinting at stronger hiring prospects down the line
Chinese property developer Country Garden Holdings manages to avoid default by paying $22.5 million in coupons but still seeking to extend payments on seven more onshore bonds by three years
Australian GDP grew 0.4% q/q in Q2 2023 vs. estimated 0.3% expansion, previous quarter growth upgraded to 0.4% from initially reported 0.2% uptick
🔴 Bearish Headline Arguments
MI inflation gauge slowed from 0.8% m/m to 0.2% in August to reflect weakening inflationary pressures
Australia’s company operating profits slumped 13.1% q/q in Q2 vs. estimated 0.1% dip and earlier 1.3% gain
Chinese Caixin services PMI fell from 54.1 in July to 51.8 in August vs. estimated 53.6 figure, reflecting slowest pace of growth in eight months
RBA kept interest rates on hold at 4.10%, cites that “further tightening may be needed” but that inflation may have already passed its peak and that uncertainties are weighing on outlook
Australian trade surplus narrowed to 8.04 billion AUD in July, as exports fell 2.0% while imports rose 2.5%
Chinese trade surplus fell from $80.6 billion to $68.4 billion in August, as imports and exports both declined again
CAD Pairs

The Canadian dollar saw lots of green this week, likely due to both rising oil prices after Saudi Arabi and Russia extended oil production cuts, and the latest Bank of Canada monetary policy statement where they made it clear that they are prepared to raise interest rates if necessary.
The week was capped off with a surprisingly strong Canadian jobs report, signaling that BOC may still need to consider another rate hike ahead.
🟢 Bullish Headline Arguments
The Bank of Canada today held its target for the overnight rate and deposit rate at 5.00% on Wednesday as expected; Sees evidence of excess demand easing, but is prepared to increase policy interest rate further if needed
Merchandise trade deficit with the world fell from a revised -C$4.9B in June to a -C$987M deficit in July
Ivey PMI for August: 53.5 vs. 48.6 previous; Prices Index rose to 66.7 vs. 65.1 previous; Employment Index rose to 54.8 vs. 54.2 in July
In a speech in Calgary, Alberta, BOC Gov. Macklem said that, aside from the delayed impact of higher interest rates, one possible reason for inflation staying above target is that “monetary policy is not yet restrictive enough.”
Canada Employment Change for August 2023: 39.9K (-8.0K forecast; -6.4K previous); Unemployment Rate was 5.5% (5.7% forecast); Average Hourly Wages: 5.2% y/y (4.8% y/y forecast)
🔴 Bearish Headline Arguments
Labor Productivity fell for the 5th consecutive quarter to -0.6% q/q (-0.3% q/q forecast; -0.8% q/q previous)
Building Permits for July: -1.5% m/m (1.9% m/m forecast; 7.5% m/m previous)
NZD Pairs

Overlay of NZD vs. Major Currencies Chart by TV
It’s was a mixed close for the New Zealand dollar, which is a bit of an improvement considering the Kiwi spent most of its week in the red.
There were no major headlines from New Zealand, suggesting that the broad risk-off sentiment was the main driver, especially with a lot of net disappointing updates coming from China this week.
🟢 Bullish Headline Arguments
Terms of Trade for quarter ending in June 2023: 0.4% q/q (-1.4% q/q forecast; -1.5% q/q previous)
Global Dairy Prices rose by +2.7% at the latest auction to $2,888
🔴 Bearish Headline Arguments
Commodity prices fell by 2.9% m/m in August due to lower dairy and lamb prices, following earlier 2.6% slump
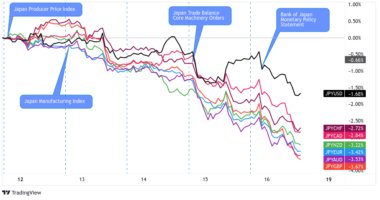
JPY Pairs

The Japanese yen had one heck of a tough week! First, all those fancy economic reports came out, and guess what they said? Yep, you guessed it – “economic slowdown” was the buzzword of the week.
But wait, there’s more! Bank of Japan officials were out there, making sure we all knew they’re not ready to party with their monetary policy just yet. They’re like that one friend who keeps saying, “I’m not leaving the party until the DJ plays my favorite song!” So, easy money it is, folks despite further signs of costs rising in the business sector.
🟢 Bullish Headline Arguments
au Jibun Bank Japan Services PMI for August: 54.3 vs. 53.8 in July; “Survey respondents often commented on stronger consumer spending and higher customer numbers, particularly from overseas“; “average cost burdens continued to rise sharply”
Japan’s Finance Ministry’s Kanda says that “it’s important for currency moves to reflect fundamentals” and that they “won’t rule out any options if speculative moves persist”
Bank lending jumped 3.1% y/y in August (vs. 2.8% expected, 2.9% previous)
Current account surplus expanded from 2.35T JPY to 2.77T JPY in July (vs. 2.24T JPY expected) as lower crude oil prices helped reduce imports
🔴 Bearish Headline Arguments
Household spending slumped further by 5.0% y/y in August instead of improving from earlier 4.2% decline to a 2.4% drop
BOJ official Nakagawa says that it is appropriate to maintain easy monetary policy since Japanese economy is not yet at the stage of achieving the inflation target stably and sustainably
Leading Economic Index: 107.6 (109.2 forecast; 108.8 previous)
Final GDP revised lower from 6.0%y/y to 4.8% y/y in Q2 due to weak capital spending
Cash earnings up by 1.3% y/y in July (vs. 2.4% expected, 2.3% previous); real wages fell by 2.5% y/y and marked its 16th consecutive monthly decline