
It was an unfortunate week to be a comdoll buyer as global growth concerns got mixed in with hawkish Fed expectations to create a generally risk-averse trading environment, lifting the yen to the top spot for the week.
We also saw the Greenback closing the week on a sour note after the highly anticipated Non-Farm Payrolls update was arguably solid in its signal of a strong employment environment, but the net job growth number did come in below expectations.
Missed the major forex headlines? Here’s what you need to know about last week’s FX scene:
USD Pairs

Hawkish expectations for comdoll central banks like the RBA and RBNZ dragged the dollar lower against NZD, AUD, and even GBP early in the week.
The dollar bulls got fired up on Thursday, though, when a bunch of U.S. labor market reports supported the Fed’s hawkish June meeting minutes.
The positive feeling was fleeting as sentiment quickly turned on Friday. The official government jobs data for June came in mixed, with focus on the slow rate of net job adds as the likely focus based on the dollar sell-off after the event.
? Bullish Headline Arguments
FOMC meeting minutes showed on Wednesday that a slower pace of hiking is likely ahead; 12 out of 18 members expect at least two more hikes this year
ADP Private Payrolls for June: 497K (160K forecast; 267K previous)
U.S. Challenger Job Cuts in June fell to an 8-month low at 40.71K (103K forecast; 80K previous)
ISM Services PMI for June: 53.9 vs. 50.3 in May; Prices Index: -2.1 to 54.1; Employment Index was up +3.9 to 53.1; New Orders Index was up +2.6 to 55.5
S&P Global U.S. Services PMI for June: 54.4 vs. 54.9 in May; “Companies noted that strong client demand and a sustained uptick in new business supported the latest expansion.”
U.S. unemployment rate dipped to 3.6% in June vs. 3.7% forecast/previous; Average Hourly Earnings: 0.4% m/m (0.3% m/m forecast; 0.4% m/m previous)
? Bearish Headline Arguments
S&P Global US Manufacturing PMI for June: 46.3 (as forecasted) vs. 48.4 in May
ISM Manufacturing PMI for June: 46.0 (48.0 forecast; 46.9 previous); Employment Index fell by -3.3 to 48.1; Prices Index fell -2.4 to 41.8
U.S. Non-Farm Payrolls for June: 209K (250K forecast; 306K previous)
EUR Pairs

It was a pretty mixed week for the euro, which mostly traded as a countercurrency despite the release of lower-tier data from the Eurozone.
There was a noticable bias towards bearishness, likely due to the weaker-than-expected round of Euro area PMI updates, but the Euro was able to recover as broad risk sentiment shifted more negative in the latter half of the week.
? Bullish Headline Arguments
ECB Governing Council member Joachim Nagel said that the interest rate hiking cycle isn’t finished as upside risks to the price outlook dominate
Germany Exports in May 2023 was -0.1% m/m (-0.7% y/y); Imports was +1.7% m/m in May (-8.6% y/y)
Germany’s HCOB final services PMI fell from 13-month high of 57.2 in May to 54.1 in June
France’s industrial production rose by 1.2% m/m in May after a 0.8% uptick in April
Germany Factory Orders for May: +6.4% m/m (+1.5% m/m forecast; +0.2% m/m previous)
? Bearish Headline Arguments
HCOB Eurozone Services PMI Business Activity Index for June: 52.0 vs. 55.1 in May:
Euro Area Industrial Producer Prices for May: -1.9% m/m (-3.2% m/m previous) and -1.8% m/m in the European Union
Spain’s HCOB services PMI dipped from 56.7 in May to 53.4 in June, ” persistent wage pressures remained the principal driver behind higher input prices”
France’s HCOB services PMI drops from 52.5 to 48.0, the strongest pace of decline since February 2021, as demand falters
HCOB Eurozone Construction PMI for June: 44.2 vs. 44.6; “marked deterioration in activity in Germany that was the steepest seen since February 2021”
Euro Area Retail Sales for May: 0.0% m/m (0.3% m/m forecast; 0.0% m/m previous); -2.9% y/y (-3.2% y/y forecast; -2.9% y/y previous)
GBP Pairs

Overlay of GBP vs. Major Currencies Chart by TV
We didn’t see a ton of data releases from the U.K., which is probably why GBP traded in tight ranges for most of the week. Like other major currencies, the pound saw action on Thursday after Uncle Sam printed strong labor market reports.
GBP looks set to end the week higher against CAD, USD, and AUD but lower against NZD and JPY, a bit of a head scratcher given the net weak PMI updates from the U.K. But it’s likely a signal traders are focusing on the expectations of more rate hikes needed by the Bank of England to fight high inflation conditions in the U.K.
? Bearish Headline Arguments
S&P Global / CIPS UK Manufacturing PMI for June: 46.5 (46.2 forecast; 47.1 previous); “manufacturers face lackluster demand in both domestic and overseas markets”; “Employment fell for the ninth month in a row, with the rate of reduction the sharpest since March”; “Average input costs declined for the second month running and to the greatest extent since February 2016.”
S&P Global / CIPS UK Services PMI in June: 53.7 vs. 55.2 previous; “Employment numbers increased for the sixth consecutive month”; “steep increase in input costs across the service economy”
The UK sold 4 billion GBP of gilts at the highest yield in 16 years on Wednesday, underscoring the elevated returns governments must offer to lure investors after more than a year of interest-rate hikes
S&P Global / CIPS UK Construction PMI for June: 48.9 vs. 51.6 in May; “Fastest decline in residential work for just over three years”
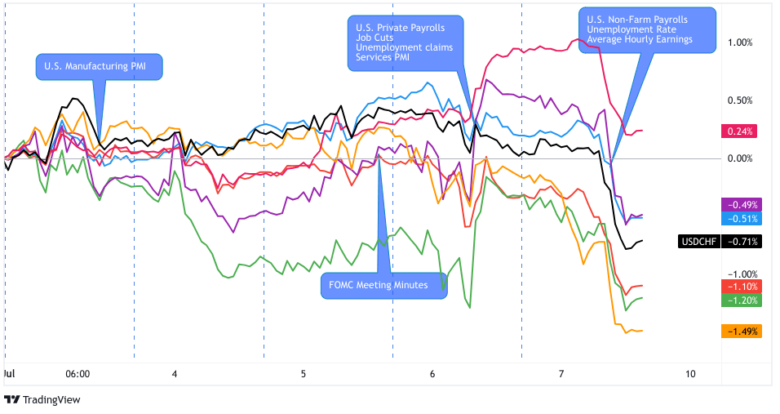
CHF Pairs

Overlay of CHF vs. Major Currencies Chart by TV
The Swiss franc mostly traded in tight ranges until Thursday when a parade of better-than-expected U.S. jobs reports encouraged USD-buying and risk-selling.
Despite that, CHF is ending the week lower against NZD, JPY, and EUR as these currencies established their leads before risk aversion peaked on Thursday.
? Bullish Headline Arguments
Procure.ch Manufacturing PMI for June: 44.9 (43.8 forecast; 43.2 previous); “Even though the output volume was almost maintained month-on-month, the decline in the order backlog suggests that near-term growth is unlikely.”
SNB governing board member Andrea Maechler said further rate hikes “cannot be ruled out”
Switzerland Unemployment Rate held at 1.9% in June (inline with forecast/previous)
? Bearish Headline Arguments
Switzerland’s CPI slowed down to 0.1% m/m in June (vs. 0.3% in May) and 1.7% y/y (vs. 2.2% in May) as air transport, petrol, diesel, and stone fruit prices decreased while fruiting vegetables and hotels increased prices.
AUD Pairs

Overlay of AUD vs. Major Currencies Chart by TV
It was a topsy-turvy week for the Australian dollar, which gained ground after the RBA gave traders a “hawkish pause” in July.
The comdoll soon lost pips against most of its major counterparts when traders focused on higher U.S. interest rate bets and global growth concerns on Thursday.
AUD was weakest against NZD and JPY and saw marginal gains against CAD by the end of the week.
? Bullish Headline Arguments
Volatile building approvals rose by 20.6% m/m in May (vs. -6.8% in April)
RBA kept its interest rates at 4.10%, and shared that inflation has “passed its peak” but that “some further tightening of monetary policy” may still be required
Retail sales were up by another 0.7% in May (vs. 0.7% expected and previous) as consumers take advantage of promotions and sales events
The trade surplus widened from 10.45B AUD to 11.79B AUD as exports (+4.4% m/m) outpaced imports (+2.5% m/m). Increases in fuel exports helped offset a decline in key iron ore and metal exports
PBOC set its yuan fixing at 7.2098 per dollar on Thursday, 360 pips stronger than the average estimate in a Bloomberg survey, and marked the largest such gap since November
? Bearish Headline Arguments
China’s Caixin manufacturing PMI slowed down from 50.9 to 50.5 in June (vs. 50.0 expected) as firms grew increasingly concerned about sluggish market conditions
China’s Caixin services PMI expanded at a slower pace (from 57.1 to 53.9) in May amidst steeper deflation, high youth unemployment, and sluggish foreign demand
Chinese banks have stopped buying bonds issued in the Shanghai free trade zone after regulators increased scrutiny of the $18 billion market
Melbourne Institute inflation gauge slowed down from 0.9% to 0.1% in May
ANZ Indeed jobs ads dipped by 2.5% m/m in June (vs. 0.1% in May). ANZ noted that “It will take time for the labour market tightness to ease” but that “the direction of change is clear.”
CAD Pairs

Overlay of CAD vs. Major Currencies Chart by TV
The Canadian dollar traded mixed in the first half of the week despite Saudi Arabia and Russia’s additional output cuts causing volatility and gains for crude oil prices.
CAD started dipping with its comdoll buddies on Wednesday, ahead of when the Fed printed a hawkish June meeting minutes and the U.S. dropped strong jobs numbers on Thursday, possibly a signal that traders see weakness growing in Canada, likely sparked by Canada’s latest PMI report.
Friday was a big day for Loonie thanks to the latest Canadian jobs data and Ivey PMI report. Overall, it wasn’t a good thing for Loonie bulls as traders possibly gave more weight to the tick higher in the unemployment rate vs. the strong net jobs gain and generally positive Ivey PMI report.
? Bullish Headline Arguments
Canada added a net 60K jobs in June (5K forecast; -17.3K previous); unemployment rate ticked higher from 5.2% to 5.4% as more people looked for work
? Bearish Headline Arguments
S&P Global Canada Manufacturing PMI for June: 48.8 vs. 49.0 in May; market demand subdued due to clients postponing spending decisions (likely due to high interest rates and macroeconomic uncertainty); modest rise in input costs; “firms on average chose to cut their employment levels”
Canada Trade Balance for May: -C$3.44B ($1.5B forecast; C$890M)
Canada Ivey PMI for June: 50.2 vs. 53.5; Employment Index: 57.6 vs. 56.2 previous; Prices Index: 60.6 vs. 60.3
NZD Pairs

There were no major data releases from New Zealand this week, so NZD’s price action moved to the beat of comdoll developments and broad demand for risk.
Relatively hawkish RBNZ expectations fueled NZD’s rallies against its major counterparts, but the party ended on Thursday when strong labor market data from the U.S. boosted the demand for USD and inspired a risk-averse trading environment.
? Bullish Headline Arguments
PBOC set its yuan fixing at 7.2098 per dollar, 360 pips stronger than the average estimate in a Bloomberg survey, and marked the largest such gap since November
? Bearish Headline Arguments
Consents for new residential buildings continue to plunge in New Zealand, down 2.6% m/m in May (from -2.6%m/m in April)
GlobalDairyTrade dairy auction prices fell sharply overnight continuing the downward trend that started in March 2022.
The ANZ World Commodity Price Index fell 2.3% m/m in June after 0.4% increase in May
JPY Pairs

The safe-haven yen traded in tight(ish) ranges against its non-comdoll counterparts in the first half of the week.
It made new intraweek lows against AUD, NZD, CAD, and GBP after the RBA’s hawkish pause encouraged hawkish speculation for the RBNZ and BOC.
Then, a bit of verbal intervention from Japanese officials and concerns over higher U.S. interest rates (supporting rising recession fears) helped push JPY higher by the end of the week.
? Bullish Headline Arguments
BOJ’s Tankan manufacturing index jumps from 1 to 5, the non-manufacturing index was also higher from 20 to 23 in Q2 as raw material costs peaked and the removal of pandemic curbs lifted factory output and consumption
Japanese average cash earnings accelerated from 0.8% to 2.5% year-over-year in May vs. 1.2% forecast, adding upside pressure on overall inflation
? Bearish Headline Arguments
Japanese Household Spending fell -4.0% y/y in May (-2.1% y/y forecast; -4.4% y/y previous)