
Inflation expectations, bond yields, and the Israel-Hamas war dominated headlines once again. But we also saw plenty of other headlines from around the globe shake up how traders were pricing in forex sentiment this week.
What were the headlines and drivers, and who among the majors came out on top?
USD Pairs

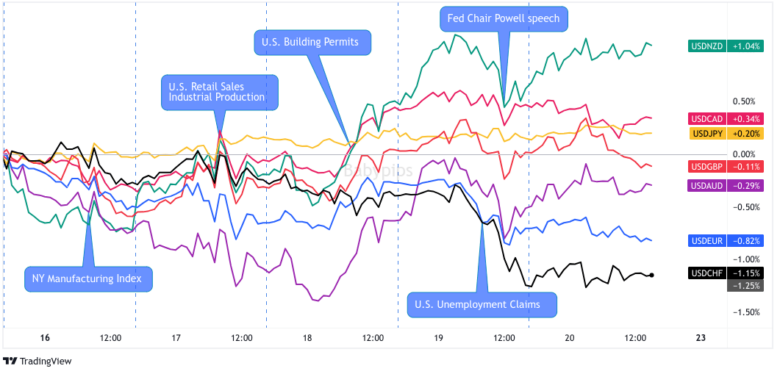
Overlay of USD vs. Major Currencies Chart by TradingView
The U.S. dollar started off in the week negative, likely due to a pullback in geopolitical fears and falling risk aversion sentiment. That sentiment shifted on Wednesday as the conflict in the Middle East flared up after an explosion was reported at a hospital in Gaza, sparking a move back into safe havens.
That rally in the Greenback was capped on Thursday, with the bears showing right around better-than-expected U.S. weekly initial jobless claims and a speech given back Fed Chair Powell. Powell’s speech was the likely driver for a short-term bearish turn as he cemented the notion that the Fed will proceed cautiously on further interest rates while keeping the door open for more if needed.
🟢 Bullish Headline Arguments
U.S. Retail Sales for September: 0.7% m/m (0.3% m/m forecast; 0.8% m/m previous); core retail sales at 0.6% m/m (0.2% m/m forecast; 0.9% m/m previous)
U.S. Industrial Production: 0.3% m/m (0.2% m/m forecast / 0.0% m/m previous)
U.S. weekly jobless claims fell to 198K vs. 211K the previous week; continuing claims rose from 1.705M to 1.734M
Fed Chair Powell gives speech at the Economic Club of New York; comments that the committee will proceed carefully, hinting of another interest rate hold at the next meeting. But given the resiliency of economic data, they are still open to another hike if necessary.
Federal Reserve Bank of Dallas President Logan is not convinced that inflation will hit the Fed’s 2% target
Cleveland Fed President Mester expressed a lean towards another interest rate increase but emphasized the need for policymakers to remain nimble due to economic uncertainties.
🔴 Bearish Headline Arguments
NAHB Housing Market Index for October: 40 (47.0 forecast; 44.0 previous)
Demand for mortgages fell to the lowest level since 1995 as interest rates near 8%
U.S. Building Permits for September: -4.4% m/m to 1.47M (-5.2% m/m forecast; 6.8% m/m previous)
Philly Fed Manufacturing Index for October: -9.0 (-7.0 forecast; -13.5 previous); Prices paid Index: 23.1 vs. 25.7 previous
U.S. Existing Home Sales for September: -2.0% m/m (-3.5% m/m previous; -0.7% m/m forecast)
EUR Pairs

Overlay of EUR vs. Major Currencies Chart by TradingView
The euro was a big net winner this week, only falling to the Swiss franc by the Friday close. Most data releases from the Euro area were not top tier events, but on net, they were arguably supportive with economic sentiment improving and inflation updates showing continued sticky conditions.
For the most part though, it’s likely the euro acted more as a counter currency and “safe haven” to the other narratives driving the market. This was especially true in the back half of the week as BOJ and Fed headlines likely kept some capital away from those currencies during risk aversion environments.
🟢 Bullish Headline Arguments
Germany’s ZEW economic sentiment improved from -11.4 to -1.1 in October (vs. -9.1 expected); Eurozone ZEW economic sentiment higher from -8.9 to 2.3 in October (vs. -7.7 expected)
Euro Area inflation Rate for September: 4.3% y/y (4.3% y/y forecast; 5.2% y/y previous); Core Inflation rate at 4.5% y/y as expected vs. 5.3% y/y previous
Euro area Current Account for August 2023: €28B surplus vs. a €21B surplus the previous month
🔴 Bearish Headline Arguments
Germany’s wholesale prices fell by 4.1% y/y in September, marking the sixth month in a row of decreases and the fastest decline since May 2020
Euro Area production in construction for August: -1.1% m/m; -0.7% m/m in the European Union
Germany’s producer prices dipped by -0.2% (vs. 0.4% expected, 0.3% previous) and 14.7% lower from a year ago in September
GBP Pairs

Overlay of GBP vs. Major Currencies Chart by TradingView
The British pound saw gains through Wednesday as broad risk sentiment generally improved, overshadowing an update showing a slowdown in wage growth (a component to the BOE’s rate policy calculus at the moment). But the bears started to gain steam on Wednesday as geopolitical fears took off, ignoring a sticky consumer inflation rate update.
The bearish Sterling sentiment was supported further for the rest of the week by weaker-than-expected updates from the consumer confidence and retail sales front, but it wasn’t enough to help the bears overcome counter currency narratives and place Sterling slightly in the green for the week.
🟢 Bullish Headline Arguments
Rightmove house price index only slightly higher from 0.4% to 0.5% as U.K. home sellers increased their asking prices at the slowest pace for any October month since 2008
U.K.’s headline CPI remains at 6.7% y/y in September (vs. 6.6% expected); core CPI eased from 6.2% to 6.1% y/y (vs. 6.0% expected)
U.K. Retail Price Index for September: 0.5% m/m (0.4% m/m forecast; 0.6% m/m previous)
🔴 Bearish Headline Arguments
U.K.’s wage growth slowed down from 8.5% to 8.1% in the three months to August compared to a year ago; pay growth excluding bonuses also dipped from 7.9% to 7.8% in August
U.K. GfK consumer confidence worsened from -21 to -30 in October as accelerating energy and mortgage costs and Middle East uncertainties weighed on confidence
U.K.’s retail activity slowed down by -0.9% in September (vs. -0.3% expected, 0.4% previous)
U.K.’s net public borrowing shot up from £10.6B to £13.5B in September
CHF Pairs

Overlay of CHF vs. Major Currencies Chart by TradingView
Much like the euro, Swiss franc moves this week were purely based on broad risk vibes, geopolitical developments and counter currency narratives, due to the fact that there were no major catalysts from Switzerland this week.
It’s overwhelming dominance in the latter half of the week when Middle East tensions were rising and dominating focus signals that the franc is the go-to currency in times of geopolitical risk, possibly due to Switzerland’s neutral stance when it comes to military and political conflicts.
🟢 Bullish Headline Arguments
Switzerland’s trade surplus widened from 3.1B CHF to 5.0B CHF in September, the largest since February 2022, as exports (8.9% m/m) outpaced imports (0.3% m/m)
AUD Pairs

Overlay of AUD vs. Major Currencies Chart by TradingView
The Aussie dollar was a big net gainer this week, a surprising outcome given the rise of market players taking focus on geopolitical risks. But if you dig into this week’s events outside of geopolitics, it’s likely that forex traders were focusing on a couple of stories to drive some bulls into the Aussie.
First, it was a busy week of updates from China (Australia’s largest trading partner), including better-than-expected GDP and industrial production numbers. But news of China adding liquidity to its banking system on Monday was likely the spark for stability and growth speculation for the region.
Second, news that a 25 bps hike was one the table at the RBA‘s latest meeting minutes seems to have surprised some traders, characterized by the jump in the Aussie on Tuesday and keeping the Aussie bid into Wednesday.
But unfortunately for the bulls, the Aussie couldn’t escape weakness sparked by geopolitics as its top correlated with the shift around the hospital explosion in Gaza, with further losses correlating to rising fears of an expected Irsaeli ground counter offensive this weekend.
🟢 Bullish Headline Arguments
China conducted MLF operations that put a net 289 billion yuan of fresh liquidity in the banking system, the biggest net injection in almost three years
RBA’s October meeting minutes showed members considered a 25bps rate hike but the case to leave the cash rate unchanged “was the stronger one”
NAB: Australia’s quarterly business confidence improved by 3 pts to -1 in Q3
🔴 Bearish Headline Arguments
Australia added a net of 6.7K jobs (vs. 20.6K expected, 63.3K previous) in September thanks to a 46.5K jump in part-time jobs offsetting the 39.9K decline in full-time employment
Australia’s unemployment rate slipped from 6.7% to 6.6% as the participation rate dropped from 67% to 66.7%
CAD Pairs

Overlay of CAD vs. Major Currencies Chart by TradingView
The Loonie was a big net loser this week as thanks to net negative economic events from Canada, most notably the surprise weaker-than-expected Canadian inflation update. All combined, it was enough to keep CAD in bear mode all week, even overshadowing the strong rise in oil prices.
🟢 Bullish Headline Arguments
Canada Housing Starts for September: +8% to 270K units vs. 250K units in August
Raw Materials Price Index for September: 3.5% m/m (1.6% m/m forecast; 3.0% m/m previous)
🔴 Bearish Headline Arguments
Canada CPI for September: -0.1% m/m (0.5% m/m forecast; 0.4% m/m previous); core CPI was -0.1% m/m (0.3% m/m forecast; 0.1% m/m previous)
The latest Bank of Canada Business Outlook Survey showed that companies expect sales to be subdued over the next year, which will likely slow plans for further business investment and employment.
Canada foreign securities purchases for August 2023: $14.9B; foreign purchases of Canadian securities fell by -$8.5B
Canada Industrial Producer Prices Index for September: 0.4% m/m (0.6% m/m forecast; 1.9% m/m previous)
Canada Retail Sales for August: -0.1% m/m (-0.3% m/m forecast; 0.4% m/m previous); core retail sales at 0.1% (-0.2% m/m forecast; 1.1% m/m previous)
NZD Pairs

Overlay of NZD vs. Major Currencies Chart by TradingView
Once again, the Kiwi had a great start to the week, this time a bullish reaction to several catalysts including NZ election results, a big improvement in services sector sentiment, and likely on China’s injection of liquidity into the banking system.
But a slower than expected inflation rate update from New Zealand got the bears rolling, and when the geopolitical fears brought on broad risk aversion behavior back, it was over for any chance of Kiwi bulls to keep the hope alive.
🟢 Bullish Headline Arguments
New Zealand’s centre-right National Party won Saturday’s general election; new PM Christopher Luxon to expected to conduct coalition negotiations
BusinessNZ services index broke three months of contraction and rose from 47.7 to 50.7 in September thanks to new orders
Dairy auction prices in New Zealand rose by 4.3% (4.4% previous) to $3.202
🔴 Bearish Headline Arguments
New Zealand’s annual inflation slowed down from 6.0% to a two-year low of 5.6% in Q2 (vs. 5.9% expected)
New Zealand’s trade deficit shrank from 2.273B NZD to 2.329B NZD in September with both exports (-18% y/y) and imports (-15% y/y) falling for the month
New Zealand’s credit card spending slowed down from 4.3% y/y to 3.3% y/y in September
JPY Pairs

Overlay of JPY vs. Major Currencies Chart by TradingView
Even with all of the geopolitical turmoil and signs of slowing economic conditions around the globe, the Japanese yen couldn’t ride the risk aversion train to gains for the week.
Japan itself had unflattering economic updates that likely kept the extremely easy monetary policy narrative going for the Bank of Japan, as well as the interest rate divergence that likely draws traders in to sell yen on the regular.
The yen’s only saving grace is the unofficial floor on the USD/JPY at 150.00, which was retested for a split second on Friday. This prompted a wick lower on the pair right around the London open, correlating with news that the Bank of Japan stepped into the JGB market as the 10-year yield hit a decade-high of 0.845%.
🟢 Bullish Headline Arguments
Japan’s trade deficit shrank from 0.55T JPY to 0.43T JPY as exports (4.3% y/y) hit record highs and outpaced imports (-16.3% y/y) in September
🔴 Bearish Headline Arguments
Japan’s tertiary industry activity dipped by -0.1% in August (vs. 0.4% expected, 1.1% previous)
Japan’s national core inflation slowed down from 3.1% y/y to 2.8% y/y in September, its first reading below 3% for the first time in more than a year
The Bank of Japan stepped into the JGB market for the fifth time this month as the 10-year yield hit a decade-high of 0.845%, amid rising U.S. yields.