
Forex volatility picked up this week thanks to top-tier economic releases, leading traders to re-price their monetary policy expectations.
The U.S. dollar was all over the charts as traders simultaneously priced in higher Fed interest rates AND maybe a not-so-soft landing and U.S. recession.
The British pound took the top spot after hot CPI data from the U.K. sparks rate hike speculation.
Meanwhile, a combo of notable slowdowns in Canada and New Zealand’s inflation rates and risk aversion pummeled the Canadian and New Zealand dollars to end the week at the bottom of the pack.
USD Pairs

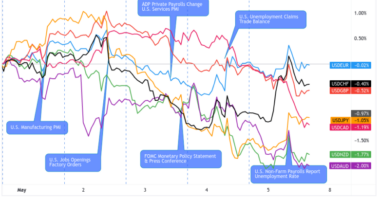
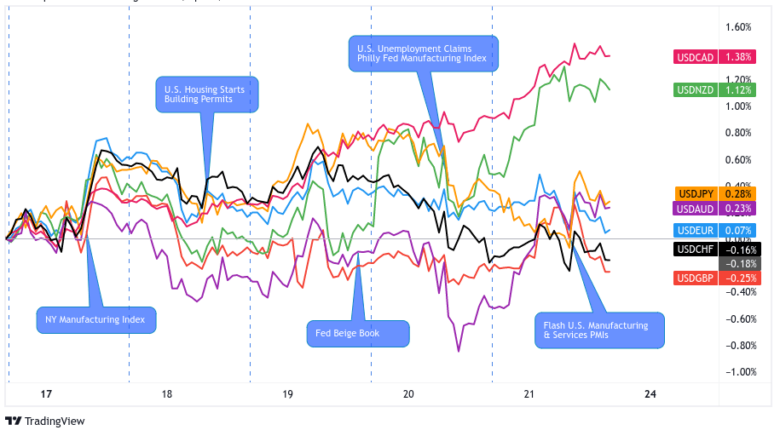
Overlay of USD Pairs: 1-Hour Forex Chart
The U.S. dollar spent the first half of the week trading a safe-haven, rising when traders worried about global growth and falling when major economies printed better-than-expected economic reports.
The tone changed some time in the middle of the week when hawkish FOMC member comments got printed alongside mid-tier economic data misses in the U.S.
The idea of rising interest rates amidst falling economic activity got traders worried about the U.S. economy and it showed. The dollar’s safe-haven status kept it in the green against “risky” bets like CAD and NZD but on shaky ground against not-so-risky currencies like JPY, CHF, and EUR.
Bullish Headline Arguments
New York state manufacturing index for April: +35 points to 10.8; Prices paid index fell -9 points; Orders index spiked by 46.8 points to 25.1
Federal Reserve Bank of St. Louis President Bullard (non-voting member) doesn’t see recession in next six months; makes argument for 50 bps hike to 5.5% to 5.75% range
On Tuesday, Federal Reserve Bank of Atlanta President Bostic said he would like to see one more rate hike before pausing and holding them above 5% for “quite some time.”
Fed official Williams: Inflation is still running too high, so Fed needs to act to lower prices and would likely take two years to reach 2% target
FOMC official Mester also assessed that inflation remains too high and that Fed has more work to do, possibly needing to hike beyond 5% and keep rates there for a while.
S&P Global U.S. Services Business Activity Index at 53.7 vs. 52.6 previous
Bearish Headline Arguments
U.S. Housing Starts for March: -0.8% m/m to 1.42M (1.3M forecast) vs. 1.43M in February; Building Permits fell by -8.8% m/m (-6.0% forecast) vs. 1.55M permits in February
U.S. mortgage applications dropped 10% w/w as the average 30-year fixed-rate rose from 6.30% to 6.43%
Fed Beige Book noted that overall economic activity was little changed in the past weeks, as only three out of nine districts reported modest growth and consumer spending was mostly flat
The Conference Board’s U.S. Leading Economic Index for March: -1.2 vs. -0.5 in February
U.S. Continuing Jobless Claims rose to the highest level since November 2021 at 1.87M, potentially signaling the difficulty for workers to find a new job
Philly Fed Manufacturing Index for April: -31.3 (-18.0 forecast) vs. -23.2 in March
U.S. Existing Home Sales for March: -2.4% m/m to 4.44M vs. +13.8% m/m in February
S&P Global U.S. Manufacturing PMI for April: 50.4 vs. 49.2 previous
EUR Pairs

Overlay of EUR Pairs: 1-Hour Forex Chart
With not a lot of top-tier data releases and market-moving ECB speeches on tap, the euro traded in wide ranges against its major counterparts.
Its lowkey safe-haven status in the Eurozone helped the common currency afloat when risk aversion gripped the markets in the second half of the week.
EUR capped the week higher against AUD, CAD, NZD, and GBP while only slightly weaker against safe-havens like USD, CHF, and JPY.
Bullish Headline Arguments
Euro area current account for February: €24 billion surplus vs. €19 billion surplus in January
Euro area final inflation read for March: -6.9% y/y as expected; -8.3% y/y as expected in the European Union
ECB Chief Economist Philip Lane signaled another potential hike next month if current outlook persists
ECB Meeting Minutes showed a majority favored the 50 bps interest rate hike in March despite global banking sector fears
ECB Lagarde still sees the need to stay vigilant on fighting high inflation conditions; dismisses the idea of reviewing the 2% inflation target
Flash Euro area Consumer Confidence for April: -17.4 vs. -19.1 in March
HCOB Flash Eurozone Services PMI at 56.6 vs. 55.0 previous
Bearish Headline Arguments
German ZEW economic sentiment index slipped from 13.0 to 4.1 in March vs. estimated improvement to 15.5, as banking sector woes dampened credit outlook
Eurozone ZEW economic sentiment index fell from 10.0 to 6.4 in March to reflect weaker optimism
HCOB Flash Eurozone manufacturing PMI for April: 45.5 vs. 47.3 previous
GBP Pairs

Overlay of GBP Pairs: 1-Hour Forex Chart
Upside surprises in the U.K.’s labor market and inflation reports supported BOE rate hike expectations and boosted GBP to its intraweek highs by mid-week.
GBP soon traded as a risk asset, however, and it soon lost a chunk of its intraweek gains when traders started worrying about sticky global inflation, high interest rates, and recession ahead.
But even when combined with a disappointing U.K. retail sales number, the British pound was able to hold onto its broad gains into the weekend.
Bullish Headline Arguments
U.K. claimant count increased by 28.2K in March vs. projected 2.5K drop in joblessness, bringing unemployment rate up from 3.7% to 3.8%
U.K. average earnings index rose from 5.7% to 5.9% in three-month period ending in February, putting upside pressure on overall inflation
U.K.’s inflation surprises to the upside, up by 10.1% y/y in March vs. 9.8% expected and 10.4% in February, as households continue to deal with high food and energy bills.
Gfk U.K. Consumer Confidence in April: -30 vs. -36 previous
U.K. Flash services PMI improves to 54.9 vs. 52.9
Bearish Headline Arguments
U.K. Retail Sales for March: -0.9% m/m (-0.5% m/m) vs. 1.1% m/m previous
U.K. Flash manufacturing PMI for April: 46.6 vs. 47.9 previous
CHF Pairs

Overlay of CHF Pairs: 1-Hour Forex Chart
A round of risk appetite early in the week weighed on CHF all the way to its intraweek lows.
The risk sentiment tides turned for the safe-haven on Thursday when a bunch of U.S. reports highlighted the U.S. economy’s weakness and soured the dollar’s rep.
Reduced Swiss banking sector concerns and CHF’s safe-haven status helped propel the currency to the top of the forex chain by the end of the week.
Bullish Headline Arguments
SNB Governing Board member Maechler suggested on Wednesday that more tightening may be needed as the latest actions may bring inflation down to only 2%, the top of its target range.
AUD Pairs

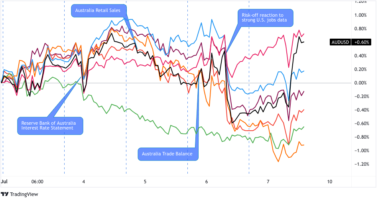
Overlay of AUD Pairs: 1-Hour Forex Chart
AUD traded in wide ranges for most of the week as traders priced in risk appetite, China’s better-than-expected data, and the RBA surprisingly almost considering a rate hike in its April meeting.
The comdoll peaked on Thursday when risk aversion dominated the markets. Though AUD capped the week still higher than its open prices, it also gave up most of its intraweek gains to end the week mixed against the majors.
Bullish Headline Arguments
RBA minutes revealed that policymakers considered hiking rates in April decision before agreeing to pause, citing need to reassess tightening given inflation, jobs, and spending outlook.
Australia’s Treasurer Jim Chalmers proposed to reform the interest rate-setting board and the Reserve Bank of Australia’s culture
Judo Australia Flash Services PMI at 52.6 vs. 48.6
Bearish Headline Arguments
Judo Australia Flash Manufacturing PMI for April: 48.1 vs. 49.1 previous
CAD Pairs

Overlay of CAD Pairs: 1-Hour Forex Chart
Risk aversion, lower crude oil prices, and Canada’s slower inflation update (opening up the idea of BOC rate cut in 2023) dragged the Canadian dollar into a slow and (un)steady downtrend, and last place against the majors for the week.
Bullish Headline Arguments
Canada monthly CPI read for March: +0.5% m/m (+0.3% m/m forecast) vs. +0.4% m/m previous.
In a testimony at the House of Commons finance committee, BOC Gov. Macklem said he’s “encouraged” by slower inflation but emphasized the “importance of staying the course and restoring price stability.”
Canada Industrial PPI for March: +0.1% m/m vs. -0.6% m/m in February; Raw materials PPI was -1.7% m/m vs. -0.3% m/m
Bearish Headline Arguments
Canada Housing Starts for March: -11% m/m to 213K units (236K starts forecast)
Canada annual CPI read for March: +4.3% y/y vs. 5.2% y/y in February
Canada Retail Sales in February: -0.2% m/m (-0.6% m/m forecast) to C$66.3B vs. +1.6% m/m in January; Core Retail Sales was -0.7% m/m (-0.1% m/m forecast) vs. +0.9% m/m previous
NZD Pairs

Overlay of NZD Pairs: 1-Hour Forex Chart
With both RBA and BOC already pausing their interest rate hikes, it was easy for New Zealand dollar traders to price in RBNZ’s rate hike pause as soon as they saw New Zealand’s CPI slowdown.
NZD, which revisited its intraweek highs on Wednesday, saw a mid-week reversal and capped the week as the second weakest major currency.
Bullish Headline Arguments
Global Dairy Prices was bid up +3.2% (-4.7% on Apr. 4) to $3.362 in Tuesday’s auction
Bearish Headline Arguments
New Zealand BusinessNZ services index down from 55.8 to 54.4 to reflect slower pace of growth in March, as the economy cooled down and general uncertainty set in.
New Zealand’s food price index chalked up 0.8% month-over-month gain in March, following earlier 1.5% increase to suggest slowing consumer price pressures.
New Zealand Q2 CPI slumped from 1.4% to 1.2% q/q versus projected increase to 1.5%, dampening RBNZ tightening hopes as energy prices tumbled.
JPY Pairs

Overlay of Inverted JPY Pairs: 1-Hour Forex Chart
Much like the Swiss franc, risk-taking and individual currency price action kept the Japanese yen in wide ranges relative to the majors for most of the week.
The safe-haven really started gaining ground when the U.S. kept on printing disappointing reports and the U.S. dollar lost its shine.
Then, a persistently high core inflation in Japan on Friday increased the possibility of (hawkish) monetary policy changes from the BOJ. This made it easier for JPY bulls to push the safe-haven higher when everyone and their momma priced in their recession worries.
Bullish Headline Arguments
Bank of Japan Governor Kazuo Ueda ruled out any abrupt policy changes in upcoming April meeting.
Japan’s core inflation held steady at 3.1% y/y in March, above BOJ’s 2% target.
Japanese flash services PMI for April showed continued optimism, but ticked lower to an index read of 54.9 vs. 55.0 in March.
Bearish Headline Arguments
The Reuters Tankan survey showed big Japanese manufacturers remaining pessimistic for a fourth straight month in April.
Japanese flash manufacturing PMI ticked higher from 49.2 to 49.5 in April to reflect slightly slower pace of industry contraction vs. estimated increase to 49.9
Japan Trade Balance for March: trade deficit increased to -¥754.7B (-¥1.1T forecast) vs. -¥898.1B previous