
Are prices in the world’s two largest economies rising or falling enough to warrant intervention?
We’ll get more clues this week when the U.S. and China print their latest inflation data. Meanwhile, the U.K. will publish its preliminary Q2 GDP reading.
Before all that, ICYMI, I’ve written a quick recap of the market themes that pushed currency pairs around last week. Check it!
And now for the closely-watched economic indicators on the calendar this week:
China’s inflation
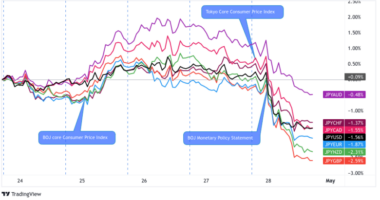
China – the world’s second-largest economy – has been seeing falling consumer prices for five consecutive months in June. China’s CPI came in at -0.2% m/m (vs. -0.2% in May) while the annual reading printed flat after a 0.2% y/y uptick in May.
On August 9 at 1:30 am GMT, we’ll see if this trend continues. Remember that while falling prices may be good for consumers, it may also cut into corporate profits and could lead to unemployment and less consumer spending. Not good for an economy that’s already seeing lower housing prices and industrial profits and shaky manufacturing and services PMIs.
Markets see China’s consumer prices falling by another 0.5% y/y in July even as the monthly reading increases by 0.2%.
Producer prices, which have been falling at a faster pace in the last six months, are expected to fall by 5.0% y/y after a 5.4% y/y drop in June.
U.S. Inflation
Rising U.S. Treasury yields and a miss in Friday’s headline NFP report are supporting talks that the Fed won’t need to hike its interest rates further.
Will Uncle Sam’s price trends support “peak rate” speculations for the Fed? The U.S. CPI (August 10, 12:30 pm GMT) is expected to maintain a 0.2% m/m growth rate.
The annualized reading could accelerate from 3.0% to 3.3% as lower energy costs from the previous year is dropped from the annual comparison. The core reading, which removes volatile prices like energy, could remain above the Fed’s 2.0% target at 4.8% y/y.
Meanwhile, monthly headline and core producer prices (August 11, 12:30 pm GMT) are seen accelerating from 0.1% to 0.2% in July while the annual core PPI could slow down from 2.4% to 2.1%.
Last but not the least is the preliminary UoM inflation expectations (August 11, 2:00 pm GMT) report that the Fed has looked at in the past. The report could print at 3.3% y/y in August, slightly slower than its 3.4% July reading.
U.K. Preliminary GDP (August 11, 6:00 am GMT)
Last month’s GDP data hinted that the King’s Coronation holiday didn’t do much to boost Britain’s economic activity in May. This is probably why the U.K. has a better chance in sustaining Q1’s 0.1% q/q growth into Q2.
Unless we see significant data hits or misses on August 11 at 6:00 am GMT, the Bank of England (BOE) will likely shrug off the lagging report in favor of keeping closer tabs on services inflation and wage growth.