The Federal Reserve’s Flow of Funds report provides only a broad overview of household finances.
Photo: Liu Jie/Zuma Press
The net worth of U.S. households rose to a record in the third quarter as the value of stock portfolios and real estate surged, a Federal Reserve report showed, and household debt also grew as stimulus programs phased out and the recovery began to slow.
Household net worth rose 3.2% in the third quarter from the second quarter to $123.52 trillion, the Fed said Thursday. Household debt rose 5.6% to $16.4 trillion, its fastest pace in at least two years.
Stock-market gains have driven much of the increase in net worth. The S&P 500 index and Dow Jones Industrial Average gained 8.5% and 7.6%, respectively, in the July-September period, building on even bigger advances in the second quarter.
The report underscores what many economists have called a K-shaped recovery from the coronavirus-induced shock early this year. More affluent Americans are doing well, while millions of others—including lower-paid workers in vulnerable jobs in retailing and restaurants—are seeing their incomes and net worth decline.
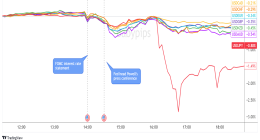
A separate report from the Labor Department Thursday showed that the number of workers seeking unemployment benefits climbed sharply to 853,000 last week, as the broader labor-market recovery cools.
The U.S. labor market has regained only 12 million of the 22 million jobs lost at the onset of the pandemic, and unemployment benefits are set to expire at the end of the year for many workers.
The Fed report, known as Flow of Funds, provides only a broad overview of household finances. Household net worth consists of the difference between assets—such as bank accounts, stock investments and real estate—minus liabilities, such as mortgage balances and consumer debt.
A booming residential real estate market has also boosted household balance sheets. Home-price gains have been driven by record-low interest rates and many people who are able to work from home moving to the suburbs from more densely populated cities.
The S&P CoreLogic Case-Shiller National Home Price Index, which measures average home prices in major metropolitan areas across the nation, rose 7% in the year that ended in September, up from a 5.8% annual rate the prior month. September marked the highest annual growth rate since May 2014.
Write to Paul Kiernan at [email protected]
Copyright ©2020 Dow Jones & Company, Inc. All Rights Reserved. 87990cbe856818d5eddac44c7b1cdeb8