The U.S. dollar may have caught most of the traders’ attention with U.S. debt talk developments and Fed speak this week, but wasn’t the best trending FX asset this week!
The New Zealand dollar was likely the best opportunity as it trended higher across the board as traders priced in hawkish RBNZ meeting expectations. The Japanese yen was a great opportunity as well as it was uniformly dragged lower against its major counterparts on improving risk sentiment vibes, dismissing net positive numbers from Japan this week.
USD Pairs
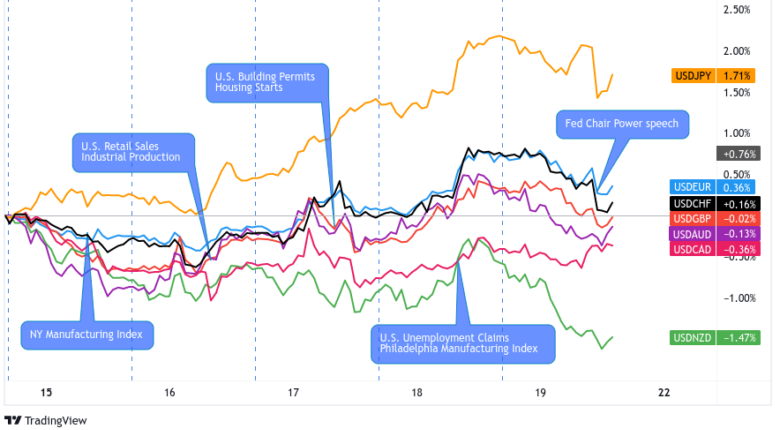
Debt ceiling concerns and mixed (but mostly hawkish) messages from FOMC members helped ensure that USD got a lot of attention this week.
USD was trading in ranges when the U.S. started poppin’ better-than-expected mid-tier economic updates that nevertheless supported a long period of high interest rates if not more rate hikes.
The dollar’s uptrends really took off on Thursday when both POTUS Biden and U.S. Congressmen assured the markets of a debt ceiling deal in the making.
The safe haven has given up some of its gains, however, and now it looks set to end the week a few pips lower against AUD, CAD, and NZD.
? Bullish Headline Arguments
Thomas Barkin, president of the Federal Reserve Bank of Richmond, stated that he wanted more evidence that inflation rates are slowing and that he would support hiking interest rates further if data showed it’s needed.
NAHB/Wells Fargo Housing Market Index in May: +5 to 50 vs. 45 previous/forecast
U.S. Retail Sales for April: +0.4% m/m (+0.7% m/m forecast) vs. -0.7% m/m previous
U.S. Industrial Production for April: +0.5% m/m (-0.1% m/m forecast) vs. 0.0% m/m previous
U.S. Housing Starts for April rose by 2.2% m/m (1.5% m/m forecast) vs. -4.5% m/m previous
U.S. Weekly jobless claims drop 22K to 242K; continuing claims fall by 8K to 1.799M
Philly Fed Manufacturing Index for May: -10.4 (-22.0 forecast) vs. -31.3 previous; “Twenty-two percent of the firms reported decreases in the prices of their own goods, 15 percent reported increases, and 63 percent reported no change.”
Federal Reserve Governor and vice chair nominee Philip Jefferson said on Thursday that inflation “is still too high, and by some measures progress has been slowing”
Dallas Fed President Lorie Logan says recent data does not point to passing over another rate hike in June
? Bearish Headline Arguments
Federal Reserve officials Kashkari and Goosbee both signal interest rate policy caution due to credit and price pressures
U.S. total household debt for Q1 2023: +0.9% q/q to $17.05T
Empire State Manufacturing Index for May: -31.8 (+8.0 forecast) vs. +10.8 in April; Employment: -3.3 vs. -8.0 previous; Prices paid: 34.9 vs. 33.0 previous; New orders: -28.0 vs. 25.1 previous
U.S. weekly mortgage applications fell by -5.7% in the week ending May 12 vs. +6.3% in the previous week; average 30-yr mortage rates frise from 6.48% to 6.57%
U.S. building permits fell by -1.5% m/m (0.2% m/m forecast) vs. -3.0% m/m previous
U.S. Existing Home Sales in April: -3.4% m/m (-1.0% m/m forecast) vs. -2.6% m/m
On Friday, Fed Chair Powell said that the policy rate may not need to rise as much to achieve goals due to tighter credit conditions in the banking sector
GOP negotiators walked out of debt ceiling deal talks on Friday
EUR Pairs

Overlay of EUR vs. Major Currencies Chart by TV
The Euro Area didn’t exactly drop economic updates that could shake the European Central Bank (ECB) and the markets’ hawkish biases.
This is probably why EUR traded in tight ranges in the first half of the week and then played risk sentiment and countercurrency games against currencies that saw market-moving updates from Wednesday to Friday.
? Bullish Headline Arguments
European Commission revised its economic forecasts and projected higher growth rates of 1.1% for this year and 1.6% in 2024, along with increased inflation rates of 5.8% in 2023 and 2.8% in 2024
Euro Area GDP (2nd Estimate) for Q1 2023: 0.1% q/q vs. 0.0% q/q previous; +1.3% y/y vs. 1.8% y/y previous; employment was up by 0.6% q/q
Euro area International Trade Goods Surplus was €25.6B in March vs. a €4.6B surplus in February
Eurozone Final CPI read for April: inline with +7.0% y/y forcast and above +6.9% y/y previous read; core CPI inline with 5.6% forecast and below 5.7% previous
Germany Producer Prices Index in April: +0.3% m/m vs. -1.4% m/m previous
During an interview with Spain’s TVE, ECB President Largarde says that the central bank is at a critical moment where inflation is slowing, but there is a need to have “high & sustainably high interest rates.”
? Bearish Headline Arguments
German wholesale price index posted 0.1% dip month-over-month in April versus projected 0.3% uptick and earlier 0.2% gain
Eurozone industrial production in march: -4.1% m/m (-1.8% m/m) vs. 1.5% m/m previous
Germany ZEW Economic Sentiment Index for May: -10.7 (-2.0 forecast) vs. 4.1 in April
GBP Pairs

Overlay of GBP vs. Major Currencies Chart by TV
GBP was trading in ranges against its major counterparts when the U.K. dropped weaker-than-expected labor market data for the month of April.
We didn’t see a lot of market-moving updates from the U.K. after that, which is probably why GBP moved to the tune of risk sentiment in the second half of the week.
GBP looks like it may end the week lower against commodity-related currencies like AUD, CAD, and NZD but higher against safe havens like JPY, CHF, and even EUR.
? Bullish Headline Arguments
On Wednesday, Bank of England Governor Bailey said that there were some indications that the pressure on inflation from the labor market was easing, but it was too early to say that the risks posed by the shortage of workers were over.
? Bearish Headline Arguments
The Conference Board Leading Economic Index for the U.K. for March: -0.9% to 77.1 vs. a -0.6% fall in February
U.K. claimant count increased by 46.7K versus the expected 31.2K figure in April, adding to the previous 28.2K rise in joblessness; unemployment rate ticked higher to 3.9% vs. 3.8% forecast/previous
CHF Pairs

Overlay of CHF vs. Major Currencies Chart by TV
CHF was confined to tight-ish ranges this week, probably because Switzerland didn’t release top-tier economic reports and because most of the safe haven drama happened with USD, JPY, and gold prices.
CHF looks set to cap the week lower against the commodity-related currencies but higher against JPY and EUR.
? Bullish Headline Arguments
Swiss producer prices rose by another 0.2% month-over-month, outpacing projected 0.1% uptick for April
AUD Pairs

Overlay of AUD vs. Major Currencies Chart by TV
Worse-than-expected industrial and retail activity in China – one of Australia’s largest trading partners – helped set the bearish tone for AUD’s intraweek trends.
It also didn’t help that Australia’s labor market data missed the analysts’ estimates.
AUD saw shallow downtrends across the board, but it looks like the comdoll can still end the week higher against its major counterparts except for CAD and NZD which are probably propped higher by higher oil prices and hawkish RBNZ expectations respectively.
? Bullish Headline Arguments
RBA May meeting minutes kept the door open for rate hikes, as policymakers remain wary of upside risks to inflation
? Bearish Headline Arguments
Australia’s wage price index showed another 0.8% quarter-over-quarter gain, short of the estimated 0.9% increase
Australian April employment change showed a surprise 4.3K in hiring losses versus an estimated 24.8K gain, the previous reading upgraded from 53K to 61.1K in employment gains, jobless rate up from 3.5% to 3.7%
CAD Pairs

Overlay of CAD vs. Major Currencies Chart by TV
Higher oil prices, a hotter-than-expected Canadian inflation report and Bank of Canada (BOC) Governor Macklem saying that it’s too early talk rate cuts likely helped CAD weather a pro-USD, generally anti-risk trading environment.
CAD saw spikes at the start of the U.S. sessions but generally still kept to wide ranges against its major counterparts.
? Bullish Headline Arguments
Canada Housing Starts in April: 261K (221K forecast) vs. 213K in March
Canada Wholesale Sales for March: -0.1% m/m (-0.4% m/m forecast) vs. -1.5% m/m
Canada CPI for April: +4.4% y/y vs. 4.3% y/y in March; +0.7% m/m vs. +0.5% m/m previous
Canada New Housing Price Index for April: -0.1% m/m (-0.1% m/m forecast) vs. 0.0% m/m previous
EIA reported on Wednesday that U.S. crude oil inventories grew by 5M barrels in the week ending May 12 to 467.6M barrels, boosted by release of inventory from the SPR
? Bearish Headline Arguments
Canada Retail Sales in March 2023: inline with -1.4% m/m forecast vs. -0.2% m/m in February; +2.4% y/y (+3.9% y/y forecast) vs. +4.1% y/y previous
NZD Pairs

Overlay of NZD vs. Major Currencies Chart by TV
With most of the major central banks already dropping their May policy decisions, traders turned their eyes on the Reserve Bank of New Zealand (RBNZ) and the likely scenario of a rate hike as early as next week.
Hawkish RBNZ expectations shielded NZD from a risk averse trading environment and pushed the currency higher against safe havens like JPY, EUR, and CHF.
? Bullish Headline Arguments
New Zealand’s annual budget release revealed that Treasury is no longer projecting a recession for the country this year.
New Zealand April trade balance showed a 427 million NZD surplus instead of the estimated 1.310 billion NZD deficit, as exports rose 10% while imports grew 12% year-over-year
? Bearish Headline Arguments
BusinessNZ Performance of Services Index for New Zealand declined by 4 points from a month earlier to 49.8 in April 2023, falling into contraction for the first time since February 2022.
Global Dairy Prices Auction Results for May 16: -0.9% to $3.488 average price
New Zealand Q1 producer input prices posted a 0.2% quarterly uptick versus an estimated 0.5% gain, producer output prices rose 0.3% versus an estimated 0.8% increase
JPY Pairs

Overlay of JPY vs. Major Currencies Chart by TV
The Japanese yen lost pips and saw downtrends against its major counterparts for most of the week despite better-than-expected Japanese data releases.
One possible reason is the yen crosses taking cues from USD/JPY, which reflected the dollar’s domination and the yen’s retreat as a safe haven preference.
? Bullish Headline Arguments
Japanese preliminary machine tool orders down by 14.4% year-over-year, marking slight improvement over earlier 15.2% slump
Japanese preliminary Q1 GDP showed 0.4% quarter-over-quarter expansion versus projected 0.2% growth figure, previous reading downgraded from 0.2% to 0.0%
Japan’s preliminary GDP price index rose from 1.2% to 2.0% year-over-year as expected
Japanese industrial production upgraded from 0.8% to 1.1% instead of staying unchanged
Japanese trade deficit narrowed from 1.21 trillion JPY to 1.02 trillion JPY in April as exports rose 2.6% year-over-year while imports fell 2.3%
Japan National Core CPI in April: 3.4% y/y (3.2% y/y forecast) vs. 3.1% y/y previous
? Bearish Headline Arguments
Producer prices in Japan increased by 5.8% from a year earlier in April 2023, easing from an upwardly revised 7.4% rise in March
On Friday, BOJ Governor Ueda once again ruled out any chance of exiting ultra-loose policy early; see the potential cost of an early exit as extremely large


