
Stronger-than-expected U.S. and U.K. data releases supported hawkish biases for the Fed and BOE, boosting both the U.S. dollar and British pound to the top of this week’s rankings.
Meanwhile, China’s growth concerns kept a lid on the demand for commodity-related currencies like AUD and NZD, as well as fueling risk aversion behavior this week.
Missed the major forex headlines? Here’s what you need to know from last week’s FX action:
USD Pairs

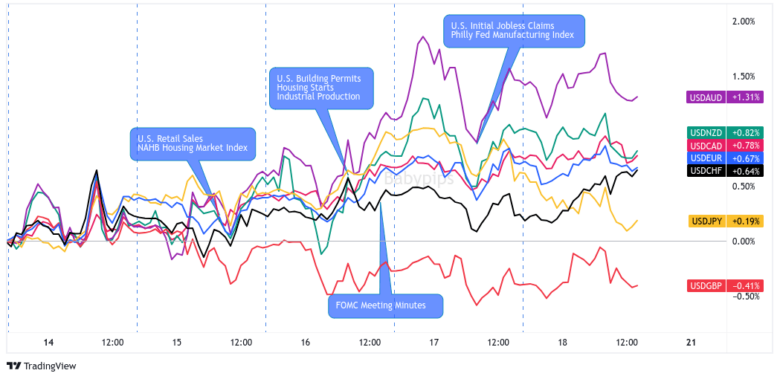
The U.S. dollar chopped around net green in first half of the week as optimism for a “soft landing” in the U.S. got mixed in with concerns over China’s growth.
The safe haven really started gaining ground on Wednesday when the FOMC meeting minutes confirmed a consensus on the 25bps July rate hike AND noted the members’ bias for further tightening amidst upside inflation risks.
The Greenback ended in the green and gained the most against comdolls like AUD, NZD, and CAD but bowed down to GBP over hawkish BOE expectations.
🟢 Bullish Headline Arguments
Retail Sales for July 2023: 0.7% m/m (0.3% m/m forecast/previous); Core Retail Sales were up 1.0% m/m (0.3% m/m forecast; 0.2% m/m previous)
Import Prices for July 2023: 0.4% m/m (0.2% m/m forecast; -0.1% m/m previous)
Minneapolis Fed President Neel Kashkari said “I’m not ready to say that we’re done” raising rates; adding that the Fed can “take a little bit more time, get some data” before deciding whether they need to do more
Industrial Production for July: 1.0% m/m (0.2% m/m forecast; -0.8% m/m previous)
FOMC meeting minutes: “Most participants continued to see significant upside risks to inflation, which could require further tightening of monetary policy” but “a couple” of participants pushed to leave rates unchanged in July.
Philly Fed Manufacturing Index for August: 12.0 (-8.0 forecast; -13.5 previous); Employment index fell from -1.0 to -6.0; Prices Paid Index rose from 9.5 to 20.8
🔴 Bearish Headline Arguments
NY Empire State Manufacturing Index for August: -19.0 (4.0 forecast, 1.1 previous)
NAHB Housing Market Index for August fell to 50.0 vs. 56.0 forecast/previous
Mortgage demand falls as the average 30-yr fixed-rate mortgage increases to 7.16% vs. 7.09% the previous week.
Building Permits for July: 0.1% m/m (1.1% m/m forecast; -3.7% previous); Housing Starts were up 3.9% m/m (1.7% m/m forecast; -11.7% m/m previous)
Weekly Initial Jobless Claims: 239.0k (241.0k forecast; 250.0k previous); continuing claims rose to 1.716M from 1.684M
EUR Pairs

Overlay of EUR vs. Major Currencies Chart by TV
There were not a lot of top-tier reports printed from the Eurozone, so EUR mostly traded as a countercurrency to broader FX themes this week.
The better-than-expected Eurozone GDP and sentiment reports as well as the euro’s lowkey safe haven status in the region probably helped the common currency end the week higher against the comdolls. EUR still traded lower against the strong GBP and safe havens like USD, CHF, and JPY, however.
🟢 Bullish Headline Arguments
German ZEW Economic Sentiment Index for August: -12.3 (-15.0 forecast; -14.7 previous)
Euro Area Flash GDP estimate for Q2 2023: +0.3% q/q vs. 0.0% q/q previous
Euro Area Industrial Production for June 2023: 0.5% m/m (-0.3% m/m; 0.0% m/m previous)
🔴 Bearish Headline Arguments
Germany Wholesale Prices for July 2023: -2.8%y/y (-2.5% y/y forecast; -2.9% y/y previous); largely driven by the -20.8% y/y drop in wholesale petroleum products
Flash Euro Area employment estimate at 0.2% q/q vs. 0.5% q/q previous
Euro Area CPI for July 2023: -0.1% m/m (-0.1% m/m forecast; 0.3% m/m previous)
GBP Pairs

Overlay of GBP vs. Major Currencies Chart by TV
The British pound was THE strongest currency this week thanks to the latest U.K.wages and core inflation figures giving room for more BOE rate hikes. Some are even pricing in a 6.00% official bank rate for the central bank this year!
GBP was already making higher highs and higher lows against the comdolls in the first half of the week, but the currency’s gains became more broad-based after the U.K. printed its hawkish data points and topping out on Thursday.
On Friday, a weaker-than-expected retail sales update from the U.K. had traders taking profit ahead of the weekend.
🟢 Bullish Headline Arguments
Average weekly earnings including bonuses up by 8.2% y/y in the three months to June, marking the fastest increase since July 2021
Headline inflation cooled from 7.9% y/y to 6.8% y/y as expected in July; core inflation remained at 6.9% y/y (vs. 6.8% y/y expected)
🔴 Bearish Headline Arguments
The unemployment rate rose from 4.0% to 4.2% in the three months to June, the highest since October 2021.
The jobless claimant count change up by 29K in July (vs. 19.6K expected, 16.2K previous)
Producer input prices fell by 3.3% y/y in July, down from June’s 2.2% y/y decline. Output (factory) prices also fell by 0.8% y/y from a 0.3% y/y increase in June.
U.K. retail sales slipped -1.2% m/m in July vs. estimated -0.6% decline and earlier 0.6% uptick (downgraded from initially reported 0.7% gain)
CHF Pairs

Overlay of CHF vs. Major Currencies Chart by TV
The Swiss franc was all over the place as a countercurrency in the first half of the week as traders priced in top-tier reports from other economies.
CHF didn’t see noticeable trends until Wednesday when fears over China’s growth accelerated comdoll weaknesses while hawkish expectations for the Fed and the BOE boosted the dollar and the pound.
🔴 Bearish Headline Arguments
Producer price index slipped by 0.1% m/m in July (vs. 0.2% expected, 0.0% previous)
Swiss Industrial Production for Q2 2023: -0.8% y/y (2.5% y/y forecast; 4.2% y/y previous)
AUD Pairs

Overlay of AUD vs. Major Currencies Chart by TV
Between China’s growth fears, Australia’s data misses, and concerns for a high-interest rate environment, it was an unfortunate week to be an Aussie bull.
Of course, it didn’t help that the RBA’s meeting minutes showed that members already believe that they can achieve their inflation target “with the cash rate staying at its present level.”
AUD was trading in wide ranges on Monday and Tuesday but eventually broke lower on Wednesday and made new weekly lows on Thursday before bearish sentiment exhausted after the flush lower sparked by the weaker-than-expected Australian employment update.
🟢 Bullish Headline Arguments
Melbourne Institute Leading Index lifted slightly from -0.67% to -0.60% in July; “Below-trend growth momentum set to extend into 2024.”
🔴 Bearish Headline Arguments
Over the weekend, China’s largest private property developer Country Garden suspended the trading of 11 of its onshore bonds starting Monday.
PBoC unexpectedly cut the rate on 401B CNY ($55.25B) worth of one-year MLF loans by 15bps to 2.50%, its second cut in three months.
China’s fixed asset investments were up by 3.4% in the first seven months of 2023 from the same period a year earlier (vs. 3.8% expected and previous)
RBA August meeting minutes: There’s a “credible path back to the inflation target with the cash rate staying at its present level”
PBoC injected 297B CNY cash via seven-day reverse repurchase contracts; sets yuan fixing that was 783 pips stronger than the average estimate
Australia’s wage price index grew by 3.6% y/y in Q2 (vs. 3.7% expected, 3.4% previous) supporting another RBA rate hike pause in September
CAD Pairs

A hotter-than-expected Canadian inflation report didn’t do the Canadian dollar favors this week as the comdoll still moved to the tune of risk sentiment.
That is, CAD traded in wide ranges before broader FX themes like anti-comdoll, pro-USD and pro-GBP trends dictated the Loonie’s price action.
CAD looks set to end the week higher against AUD and NZD but lower against the safe havens, GBP, and even EUR.
🟢 Bullish Headline Arguments
CPI for July: 0.6% m/m (0.4% m/m forecast; 0.1% m/m previous); core CPI was 0.5% m/m (0.5% m/m forecast; -0.1% m/m previous)
Wholesales trade for June: 2.8% m/m (-4.4% m/m forecast; 2.9% m/m previous)
🔴 Bearish Headline Arguments
Housing Starts for July fell -10% y/y to 255.0k (243.0k forecast; 283.5k previous)
NZD Pairs

Much like the Australian dollar, NZD traded in wide ranges in the first half of the week before risk aversion and Chinese growth concerns dragged the comdoll lower.
Kiwi looks set to end the week lower across the board except against the Aussie.
NZD is only a tiny bit stronger than AUD this week but that’s probably because of the RBNZ’s “hawkish hold” decision against the RBA’s not-so-hawkish meeting minutes.
🟢 Bullish Headline Arguments
Overseas visitor arrivals were up by 11.3% in June after three consecutive months of decline
New Zealand removed the last of its COVID restrictions including mandatory masks and isolation for those who tested positive.
As expected, the RBNZ kept its official cash rate unchanged at 5.5% in August, and said rates “need to remain at a restrictive level for the foreseeable future”
🔴 Bearish Headline Arguments
BusinessNZ services index further contracted from 49.6 to 47.8 in July; “the results all point to a sharp drop in demand in July, significantly accelerating the slowing trend that had been evident for many months”
Global Dairy Prices Index for Aug. 15, 2023: -7.4% to $2.875
RBNZ Gov. Orr said mild inflation is the “bare minimum we need to see” before considering rate cuts. He added that “We don’t feel a rush to be changing rates anytime soon”
JPY Pairs

Talks of a “YENtervention” kept a lid on JPY’s gains and even inspired downswings early in the week.
The yen eventually behaved as a safe haven though. That is, it closed higher against the comdolls and EUR while taking a backseat to the hawkish central bank expectations that drove the U.S. dollar and British pound higher this week.
🟢 Bullish Headline Arguments
Industrial output revised higher from 2.0% to 2.4% m/m in June (vs. -2.2% in May)
GDP grew by 1.5% q/q in Q2 (vs. 0.8% expected, 0.7% previous); annual GDP was up by 6.0% (vs. 3.6% previous) as auto exports and tourist arrivals helped offset slowing consumer recovery
Japanese national core CPI slowed from 3.3% y/y to 3.1% as expected in July, as unit labor costs are barely increasing
Japan services inflation rose to 2% in July for the first time in 30 years, raising the argument for policy normalization.
🔴 Bearish Headline Arguments
Japan Trade Balance for July: -78.7B (26.0B forecast; 43.1B previous)
This post first appeared on babypips.com