
Resurfacing banking sector woes, U.S. recession fears, and debt ceiling concerns kept risk-off flows in play for the most part of the week, weighing on higher-yielding currencies.
Despite their safe-haven appeal, the dollar and the yen still struggled to stay afloat, as U.S. data fell short of estimates while a cautious BOJ decision loomed.
The British pound took the top spot this week, likely due to a lack of negative headlines from the U.K., allowing traders to continue to ride the bullish vibes sparked last week from a strong U.K. inflation update.
USD Pairs

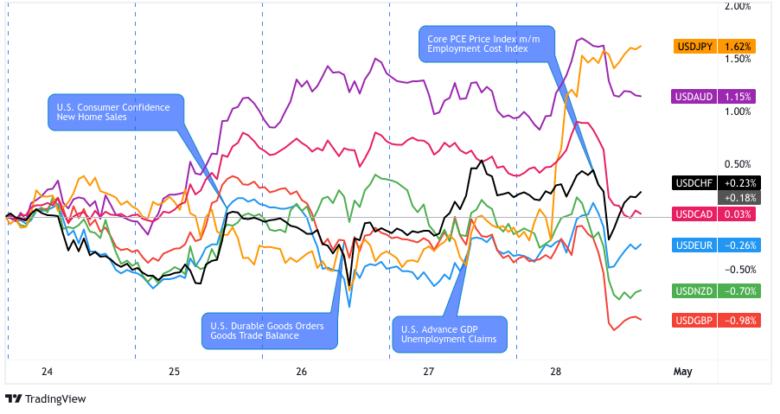
The U.S. dollar saw plenty of choppy price action, as traders had to balance economic updates that showed both sticky high inflation conditions and signs of economic growth slowing.
But based on the net bearish lean for the Greenback seen in the chart above, it looks like traders were focused more on the narrative of rising recession odds and speculation that the Fed is likely to reach the peak of its hiking cycle very soon.
? Bullish Headline Arguments
U.S. Durable Goods Orders for March: +3.2% m/m $276.4B vs. a lower revised -1.2% m/m previous; Core Durable Goods Orders came in at +0.3% m/m (+0.1% m/m forecast) vs. -0.3% m/m previous
U.S. Mortgage Applications in the week ended April 21 rose by 4.6% w/w; despite a rise in the 30-year fixed mortgage by 12 bps to 6.55% (a one-month high)
U.S. Advance quarterly Core PCE Prices Index came in hot at 4.9% q/q (+4.1% q/q forecast) vs. 4.4% q/q previous
U.S. Weekly Initial Jobless Claims for week ending Apr. 22: 230K vs. 246K previous week
Chicago PMI for April: 48.6 (46.0 forecast) vs. 43.5 in March
U.S. employment cost index rose by 1.2% q/q (seasonally adjusted) in Q1 2023, stronger than the 1% q/q forecast by economists
U.S. consumer sentiment for April: 63.5 vs. 62.0 – University of Michigan
? Bearish Headline Arguments
Dallas Fed Manufacturing Activity for April: -23.4 (-11.0 forecast) vs. -15.7 in March; Employment index fell 2.4 points to 8.0; wages and benefits index climbed to 37.6, above the average rate of 21.0
U.S. Treasury Secretary Yellen said that a failure to raise the debt ceiling would result in a default, triggering an “economic catastrophe”
U.S. Consumer confidence index fell to 101.3 in April (106.0 forecast) vs. 104.0 previous
S&P/Case-Shiller U.S.Home Price Index: +0.4% y/y (+1.3% y/y forecast) vs. 2.6% y/y previous
U.S. Advance GDP read for Q1 2023: +1.1% q/q vs. +2.6% q/q previous; Core PCE Prices came in hot at 4.9% q/q (+4.1% q/q forecast) vs. 4.4% q/q previous
U.S. Pending Home Sales for March: -5.2% m/m (+0.3% m/m forecast) vs. 0.0% previous; lower sales due to lack of supply
EUR Pairs

Overlay of EUR Pairs: 1-Hour Forex Chart
The euro was a broad net winner this week, likely supported by ECB officials maintaining their calls for rate hikes at their next monetary policy meeting.
Economic data was also net supportive for rate hike speculation, most notably from the persistently high inflation updates, improving survey sentiment data, and signs that the euro area will avoid a technical recession.
? Bullish Headline Arguments
Germany Ifo Business Climate Index for April: 93.6 vs. 93.2 previous
ECB Chief Economist Lane said on Monday that current data warrants another interest rate hike at the ECB’s next meeting in May
German GfK consumer climate index improved from -29.3 to -25.7 vs. -28.0 forecast, as income expectations recovered significantly in April
German Preliminary Inflation read for April: +7.2% y/y vs. +7.4% y/y in March
European Central Bank Vice President Luis de Guindos thinks that the euro-area may avoid recession
Germany raised its 2023 growth forecasts from 0.2% to 0.4% on stronger-than-expected manufacturing at the start of the year
Euro Area Economic Sentiment Indicator (ESI) for April: 99.3 (99.8 forecast) vs. 99.2; European Union ESI was unchanged at 97.3
Euro area flash GDP read for Q1 2023: +0.1% q/q as expected vs. +0.0% previous
? Bearish Headline Arguments
France Consumer Sentiment Index for April: 83 (81 forecast) vs. 82 in March
Germany Flash GDP for Q1 2023: 0.0% q/q (0.1% q/q forecast) vs. -0.5% q/q previous read (revised lower from -0.4% q/q)
GBP Pairs

The U.K. had a few low tier economic updates this week, which didn’t seem to have much influence on Sterling. It was likely able to escape the early broad risk-off vibes riding the upward priced momentum sparked by last week’s hot inflation updates from the U.K.
? Bullish Headline Arguments
U.K.’s public sector net borrowing came in at 21.5B in March – the second-largest March borrowing on record – as the government continues its energy support schemes
CBI’s U.K. retail industry survey improved from +1 in March to +5 in April though retailers don’t expect lasting improvement.
? Bearish Headline Arguments
Property website Rightmove: Average asking prices for properties up by 0.2% m/m in April, less than the 1.2% gain seen at this time of year.
CHF Pairs

Overlay of CHF Pairs: 1-Hour Forex Chart
The Swiss franc closed out mixed against the majors on Friday, after spending the early part of the week in the green, likely due to the risk-off vibes across the broad markets.
It’s gains were likely limited by banking sector fears, characterized by its peak on Wednesday correlating with fresh banking sector headlines from the U.S. (Banking sector jitters return as First Republic bank considers sale of $100 billion in assets amid deposit run of $72 billion in Q1)
? Bullish Headline Arguments
Switzerland’s trade surplus widened from 3.31B CHF to 4.53B CHF in March as exports grew by 19.9% m/m while imports rose by 15.9% m/m
? Bearish Headline Arguments
Swiss retail sales for March:-1.9% y/y vs. -0.5% y/y previous; monthly read came in at -0.1% m/m
Swiss National Bank President Thomas Jordan warned of tougher regulations ahead for the banking sector on Friday
KOF Swiss Economic Barometer for April: 96.38 vs. 99.23
AUD Pairs

Overlay of AUD Pairs: 1-Hour Forex Chart
The Aussie saw selling pressure right off the bat, likely due to traders pricing in expectations of weaker-than-expected consumer prices updates from Australia later in the week.
The actual CPI number was lower-than-expected, prompting further AUD selling through the Wednesday U.S. session.
The Aussie has taken back some of its losses since then, likely on short-term profit taking, but remained down on the week. Traders aren’t likely to give up their shorts ahead of what could be another bearish event with the next Reserve Bank of Australia statement coming early next week.
? Bullish Headline Arguments
Australia’s producer price increases accelerated from 0.4% to 1.0% q/q in Q4. On an annualized basis, prices rose by 5.2% (vs. 5.0% expected)
? Bearish Headline Arguments
Australia’s Q1 CPI dipped from 1.9% quarter-over-quarter to 1.4%, bringing annual inflation figure down from 6.8% to 6.3% vs. 6.5% forecast
Australia Import Prices Index for Q1 2023: -4.2% q/q (+0.7% q/q forecast) vs. +1.8% q/q previous
Australia Private Sector Credit for March: +6.8% y/y (+7.4% y/y forecast) vs. +7.6% y/y previous
CAD Pairs

Overlay of CAD Pairs: 1-Hour Forex Chart
The Loonie was a net loser this week, quickly pressured lower by falling oil prices and risk-off vibes early on, and possibly some continued selling pressure sparked by last week’s weaker-than-expected Canadian inflation update.
? Bullish Headline Arguments
EIA reported that or the week ending April 21, 2023, commercial crude oil invetories (ex SPR) fell by 5.1M bbl to 460.9M bbl
? Bearish Headline Arguments
Bank of Canada Summary of Deliberations: considered a rate hike in April due to Canada’s stronger-than-expected growth; but ultimately held because of easing demand and inflation metrics; sees 3% inflation this Summer and 2% by late 2024.
Canada GDP for February: +0.1% m/m (+0.3% m/m forecast) vs. +0.6% m/m previous
NZD Pairs

The Kiwi dollar was a strong net winner despite net negative data updates from New Zealand this week. This suggests that it likely benefited more from weak counter currency narratives rather than NZ catalysts, and the shift towards risk-on at the end of the week.
? Bullish Headline Arguments
NZ PM Chris Hipkins commits to reducing spending and no new taxes this year
? Bearish Headline Arguments
New Zealand credit card spending slowed from 25.5% year-over-year to 20.3% in March
New Zealand Trade Balance for March 2023: -NZ$1.27B (-NZ$0.7B forecast) vs. -NZ$0.8B previous
ANZ: New Zealand business confidence largely unchanged with 43.8% (from 43.4%) of respondents expecting the economy to deteriorate as of April.
JPY Pairs

It was an up and down week for the Japanese yen as traders went bullish on JPY on Tuesday after a hot read from the BOJ’s core CPI update. Broad markets were also turning towards risk aversion behavior on Tuesday, likely supporting the yen through mid-week.
Risk sentiment shifted back to risk-on on Thursday, likely moving with a heavy dose of positive company earnings from the U.S.
And by Friday, yen bears were back in control, especially after the BOJ’s monetary policy statement. At that event, they held off on any policy changes for now and stated their intentions of doing a monetary policy review that could take more than a year, dashing hopes of monetary policy normalization any time soon.
? Bullish Headline Arguments
BOJ’s core CPI inched higher from 2.7% to 2.9% y/y in March
Japan’s business services inflation up by 1.8% in FY 2022 (from 1.2% in 2021), the fastest increase since FY 2014
On Tuesday, BOJ Gov. Ueda maintained that “it’s appropriate to maintain monetary easing” for now but also said that BOJ stands ready to raise interest rates “if wage growth and inflation accelerates faster than expected”
Tokyo’s CPI – considered a leading indicator for Japan’s inflation – accelerated from 3.2% to 3.5% y/y in April
Japan’s retail sales rose by 7.2% y/y in March against the 5.8% expected and 7.3% increase in February
The Bank of Japan removed forward guidance and announced its intentions to review monetary policy
The Bank of Japan raised its core CPI forecast for 2023 to 1.8% y/y from 1.6% y/y; core CPI forecast for 2024 is now 2.0% y/y vs. 1.8% y/y previous
? Bearish Headline Arguments
Japan’s unemployment rate jumped from 2.6% to 2.8% in March (vs. 2.5% expected)
An early reading of Japan’s factory output showed an 0.8% m/m gain in March, slower than the upwardly revised 4.6% February uptick but faster than the 0.5% growth estimates
The Bank of Japan held off on any changes to its monetary policy (interest rate stays at -0.10%; yield curve control range on 10-yr bonds stays at 0.50% on either side of 0.0% target) on Friday; monetary policy review may take a year or longer.