
A huge step to upscaling your business is to move from having data to using data.
As a small business, you may have a tight consumer base. Sure, you will try and experiment with your products/services and gauge their response as per the sales generated. However, there’s a step between introducing a service and getting a conversion rate. This step is data visualization. While many marketing analytics software is available, the pre-requisite to analyzing data is effectively visualizing it.
If you’ve been scratching your head about using data visualization to your benefit, read on. After all, 40% of companies use it frequently. So that’s something to take into consideration.
The article enlists eight free data visualization tools to consider.
Best Free Data Visualization Software
Data, if used accurately, has the potential to enhance or completely transform your online business. Say you have a data set stored in your excel sheet. You need to make a chart, graph, or visual element from this data to be usable, and you won’t be able to make informed decisions from the data. How else do you draw out trends and patterns and analyze consumer behaviors?
Many marketing reporting tools are also available to take marketing to the next level. While some data visualization tools have paid versions, there are many free data visualization tools with great features. The best part? You don’t need to rely on IT support.
A business deals with big consumer data. However, if the data is visualized, it could be easier to make sense of the available information.
Let’s dive right in.
1. Microsoft Power BI
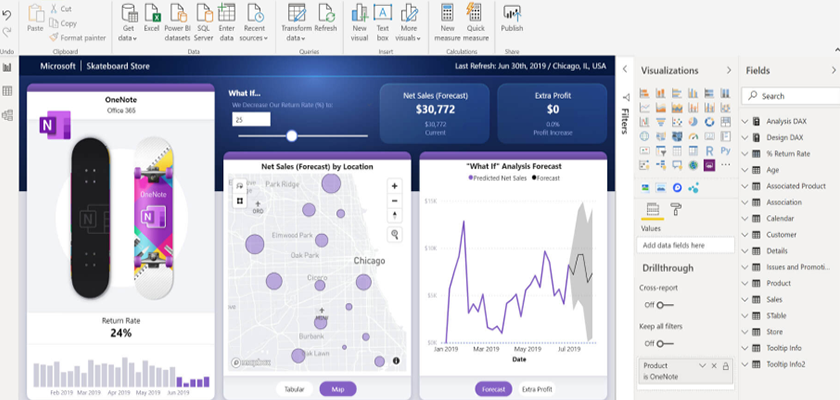
Microsoft Power BI is a business intelligence platform that provides a suite of data visualization and analysis tools for creating interactive dashboards, reports, and charts. It allows users to connect to a wide variety of data sources such as Excel spreadsheets, databases, cloud-based services, and many others.
In my opinion, Microsoft Power BI is one of the most powerful business intelligence tools available in the market today. It is a cloud-based data visualization and analysis platform that helps businesses of all sizes to gain insights from their data. one of the key strengths of Power BI is its user-friendly interface, which allows users to easily navigate and customize their data visualizations. It also offers a range of collaboration and sharing features, making it easy to share reports and dashboards with colleagues and stakeholders.
2. Google Data Studio
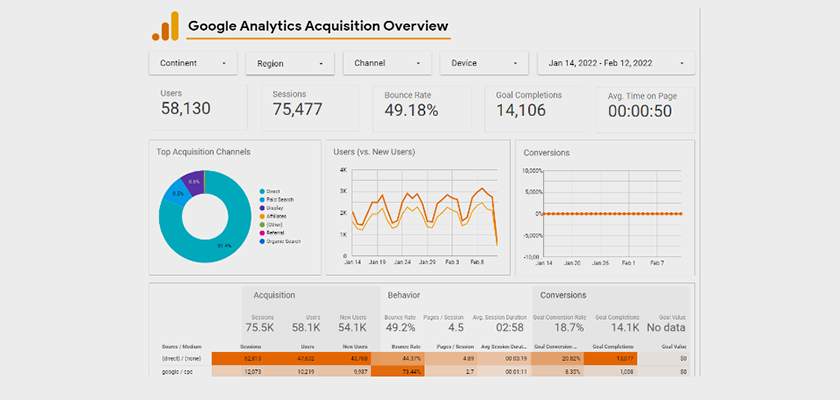
Google Data Studio is an excellent tool for creating and sharing custom data visualizations and reports. It is a free and cloud-based platform that allows users to connect to a variety of data sources and create visually stunning reports and dashboards.
It is designed to be user-friendly and intuitive, even for users with little or no experience in data analysis. It offers a range of pre-built templates and connectors, making it easy to connect to popular data sources such as Google Analytics, Google Sheets, and more. Overall, Google Data Studio is a powerful and flexible platform that can help businesses unlock the full potential of their data.
3. DataWrapper
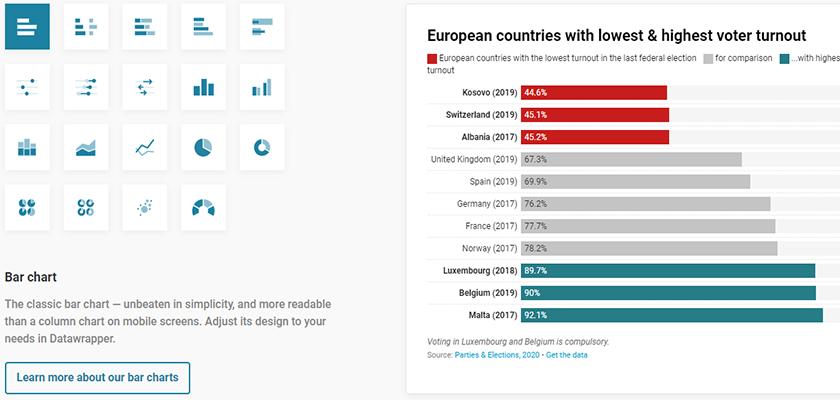
DataWrapper was built by many developers, journalists, and designers from several European countries and some from the United States. The tool was made with the primary intent of helping journalists create data visualization charts quickly to provide a base for their stories. However, it can be used by anyone or any business looking for similar data representations. It also features numerous collaboration tools, allowing users to share their reports and dashboards with team members and other stakeholders.
The free version of this tool allows you to create up to 10,000 charts, while the paid version supports more than that. It is a web-based tool with an academy space in case you or your team wants to take online learning classes using this tool. Plus, the tool offers a gallery area to upload data and their visualizations for sharing.
4. Looker
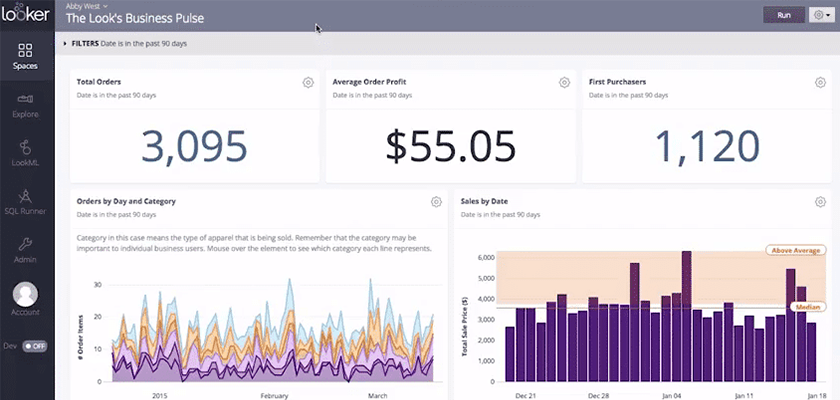
Looker is a highly capable data analytics and business intelligence platform that offers a vast array of features and functionality. It is a cloud-based solution that enables companies of all sizes to connect to their data sources and build custom data visualizations, reports, and dashboards. It also features numerous collaboration tools, allowing users to share their reports and dashboards with team members and other stakeholders.
Looker is a powerful and flexible platform that can help businesses unleash the full potential of their data. Whether you’re looking to gain insights from customer data, track key performance metrics, or analyze business operations, Looker offers the tools and features you need to succeed.
5. Zoho Analytics
Zoho Analytics is an excellent business intelligence and analytics tool that helps organizations analyze data and make informed decisions. From my perspective, one of the key benefits of Zoho Analytics is its user-friendly interface. I think it’s easy to navigate, even for users who may not be familiar with data analytics. It offers drag-and-drop functionality, which makes it easy to create custom reports and dashboards without the need for complex coding.
Zoho Analytics is a powerful and user-friendly tool that offers a wide range of features for data analysis and reporting. Whether you’re a small business owner or a large enterprise, I think it’s worth considering as a solution for your data analytics needs.
6. Google Chart
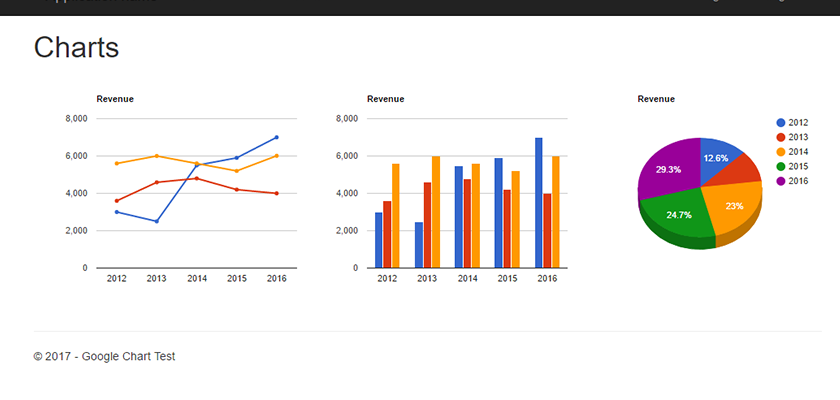
Google Chart is a free, web-based tool provided by Google that allows users to create interactive charts and graphs for data visualization. It is a useful tool for creating visually appealing and informative charts that can be embedded on web pages and shared with others.
Google Charts offers a variety of chart types including line, bar, pie, and scatter charts, as well as more advanced options like geo charts and timelines. It also provides customization options such as changing colors, fonts, and chart titles. one of the advantages of Google Charts is its ease of use. It uses a simple and intuitive API that makes it easy for developers to integrate charts into web applications. Additionally, it supports a wide range of data formats and provides real-time updates for dynamic data.
7. Infogram
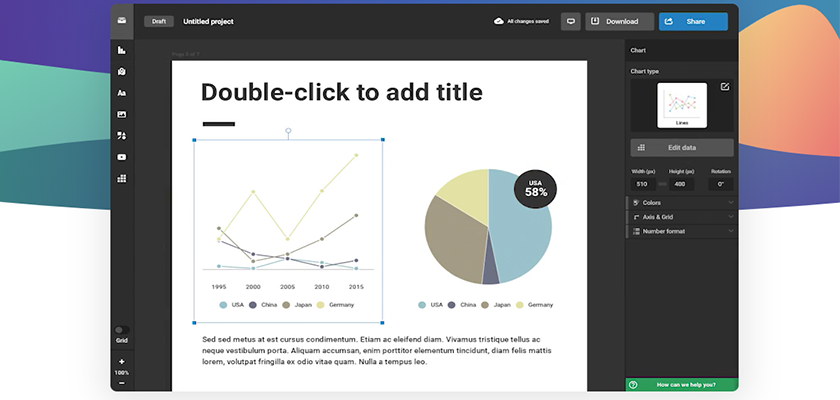
If you belong from a non-technical background and are looking for a tool that publishes data online fast, Infogram is your go-to data visualization tool. It’s designed to keep non-technical users like designers, marketers, and other business professionals in mind. While the paid version of this tool unlocks many features, you can try them out for free for a certain period.
The free version of this tool lets you create up to 10 projects. The tool offers the following features:
- Drag and drop interface
- Interactive charts and graphs
- Over 35 other types of charts.
You can create and publish the projects on platforms as apps for free.
So try this tool out if you want to dive deep into creating fancy images for Facebook, slides, posters, and other infographics! It’s certainly one of those free data visualization tools you need to use!
8. AgencyAnalytics
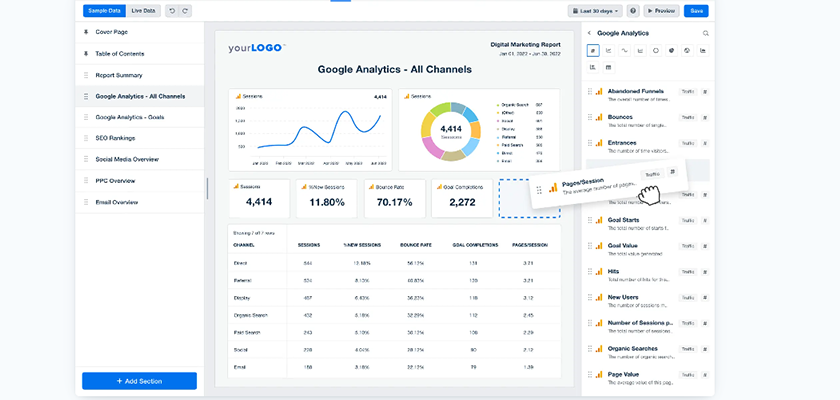
AgencyAnalytics is a digital marketing and SEO reporting tool that allows agencies and businesses to track and analyze website traffic, keyword rankings, social media metrics, and more. From my perspective, It can be considered a powerful tool that provides a comprehensive overview of digital marketing performance.
Agency Analytics offers a range of features including customizable dashboards, white-label reporting, and integrations with a variety of third-party tools including Google Analytics, Facebook, Twitter, and more. It allows users to create custom reports for clients and provides real-time data updates.
9. HubSpot
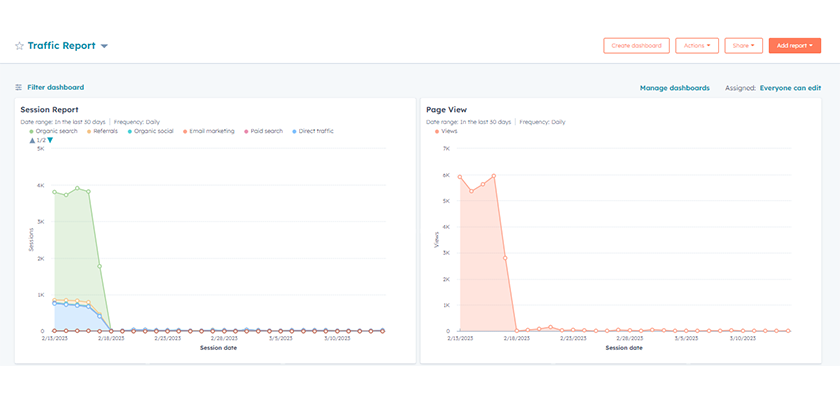
HubSpot is a customer relationship management (CRM) software platform that also offers powerful data visualization tools for businesses of all sizes. In my opinion, it’s a valuable tool that allows businesses to manage their interactions with customers while also providing clear and insightful data visualizations.
HubSpot’s data visualization tools offer a range of features including customizable dashboards, advanced reporting, and integrations with a variety of third-party tools including Google Analytics and Salesforce. These tools provide businesses with real-time insights into their sales and marketing performance and help to identify areas for improvement.
10. Whatagraph
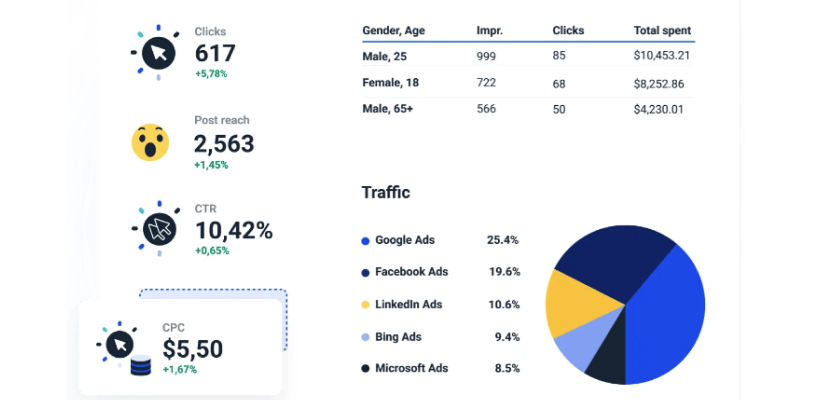
One of the best data visualization tools Whatagraph is mostly used by marketing agencies in order to create meaningful and more actionable data for their clients. It illustrates the raw data in a clear and decision-driven version. While doing that, Whatagraph offers multiple datasets to visualize the data such as pie charts, bar charts, graphs, images, and maps. The visualized data can boost the interaction between agencies and their clients.
By using Whatagraph, it would be fair to say goodbye to Excel sheets or a team of data analysts. Good news! Since Whatagraph also has been featured in marketing reporting, you can connect your tools and visualize all your KPIs in a beautiful dashboard and get real-time reports which allow clients to give instant reactions.
Wrapping Up
The article enlists the best free data visualization tools to dig your toes in data visualization. However, data visualization requires a large set of data for accurate conclusions. So if you’re a small business, trying your hands at data visualization might not be for you just yet. Consider using these tools when your business upscales to medium size for effective results. While if you’re a large-scale business, data visualization is a must. It won’t only simplify a humongous data set but will also help you make quick and informed business decisions.
Take this article as your cue to try out any data visualization tools. Be ready for trial and error to find tools that best suit your business requirements. Go, research, and implement!